Canada’s Fiscal Response to COVID is the Largest in the Industrialized World

General Mark Goode 3 Dec

Federal Fiscal Update–Finance Minister Freeland’s Debut

Justin Trudeau’s government, which has delivered the biggest COVID-19 fiscal response in the industrialized world, announced plans for another dose of stimulus and vowed to continue priming the pump as long as needed.

Finance Minister Chrystia Freeland unveiled $51.7 billion of new spending over two years in a mini-budget Monday, led by an enhanced wages subsidy for business. Freeland also pledged, without detailing, another $70 billion to $100 billion of additional stimulus over three years to spur the recovery.

But the finance minister clearly heeded calls for fiscal prudence. She put off any major structural spending announcements, promised any additional stimulus will be temporary and introduced new taxes on digital giants including Netflix, Amazon, and Airbnb, to help pay for it all.

“Our government will make carefully judged, targeted and meaningful investments to create jobs and boost growth,” Freeland said. It will provide “the fiscal support the Canadian economy needs to operate at its full capacity and to stop COVID-19 from doing long-term damage to our economic potential.”

Freeland revised higher the nation’s projected deficit this year to $381.6 billion, or 17.5% of GDP. That’s up from a deficit of 1.7% of GDP last year. According to estimates from the International Monetary Fund, no major economy will show a bigger fiscal swing in 2020.

The budgetary red ink is projected at $121 billion next year, before any additional stimulus. In total, spending linked to the government’s COVID response accounted for C$75 billion of this year’s deficit, and C$51 billion next year.

Based on Monday’s projections, the deficit is seen gradually narrowing to about $51 billion in two years and $25 billion by 2025.

The planned stimulus over the next three years will total no more than 4% of GDP, which the document said is in line with the Bank of Canada’s estimate of the level of slack in the economy. Freeland said, “fiscal guardrails” tied to the labour market would help determine the extent of the additional stimulus.

Among the measures announced today, Freeland boosted the government’s wage subsidy program (Canada Emergency Wage Subsidy, CEWS) to cover as much as 75% of payroll costs for businesses and extended its commercial rent subsidy and lockdown support top-ups until March. Both were slated to run out on December 20. The current cap on CEWS was 65%.

The federal government plans to create a new funding program to help restaurants, tourism companies and other businesses in industries hardest hit by COVID-19.

The Highly Affected Sectors Credit Availability Program (HASCAP), which was announced in the government’s fiscal update Monday, will offer eligible businesses loans of up to $1 million, with a 10-year term.

The money will be lent by banks or other financial institutions, but guaranteed by the federal government.

“We know that businesses in tourism, hospitality, travel, arts and culture have been particularly hard-hit. So we’re creating a new stream of support for those businesses that need it most — a credit availability program with 100-per-cent government-backed loan support and favourable terms for businesses that have lost revenue as people stay home to fight the spread of the virus,” Finance Minister Chrystia Freeland said in her prepared speech to the House of Commons.

Establishing a national childcare plan is a key long-term goal, with Freeland vowing a detailed plan in next year’s budget. In her forward to the fiscal update, she described the daycare strategy as “a feminist plan” that also “makes sound business sense.”

As a start, the Liberals are proposing in their fiscal update to spend $420 million in grants and bursaries to help provinces and territories train and retain qualified early childhood educators.

The Liberals are also proposing to spend $20 million over five years to build a child-care secretariat to guide federal policy work, plus $15 million in ongoing spending for a similar Indigenous-focused body.

The money is designed to lay the foundation for what will likely be a big-money promise in the coming budget.

Current federal spending on child care expires near the end of the decade, but the Liberals are proposing now to keep the money flowing, starting with $870 million a year in 2028.

There is also money for action on climate change. The government allocated C$2.6 billion in grants for homeowners to improve efficiency and $150 million over three years for electric vehicle charging stations.

The government also detailed some help for the hard-hit tourism sector, including funding for airports. But with Transport Minister Marc Garneau’s negotiations with airlines underway, there is no specific money for carriers including Air Canada and WestJet Airlines Ltd.

Bottom Line

There will continue to be great concern about the largest budget deficits since World War II. Does Canada really need the proportionately largest COVID fiscal response in the industrialized world?  The outlook is somewhat less dire than when the government released a fiscal snapshot in July. The unemployment rate at 8.9% is down materially from May’s 13.7% high but well above February’s 5.6%. The economy recovered ground through the third quarter, although the second wave of pandemic and ensuing restrictions undoubtedly will topple economic activity this quarter.

There is little worry that the government can sustain a massive deficit this year. It can, given low debt levels entering the crisis and historically low interest rates. But now that it has no fiscal guardrails, there’s a risk debt-to-GDP will continue to rise in the medium term if it continues to spend ambitiously.

The government is adding a new revenue source by taxing large digital companies. Still, in time, with this level of spending, they will be tempted to raise taxes on domestic sources, for example, hikes in the GST and higher capital gains taxes. This would be misguided, given the fragility of the recovery.

There is a greater risk that the government is overdoing the stimulus with vaccines on the horizon than undergoing it. Canada’s programs have been generous and household-focused compared to our G7 peers. The government must be strategic in assuring that new program spending is focused on future growth, beyond the pandemic, so that our debt-to-GDP will resume its downward trend. The risk is that once created; it is difficult to rein in spending.

DLC UPDATE: Canada’s Jobs Recovery Slowed in October With New Pandemic Restrictions

General Mark Goode 6 Nov

Canada’s Jobs Recovery Slowed in October With New Pandemic Restrictions

The October Labour Force Survey, released this morning by Stats Canada, showed an employment increase of 83,600–well below the 378,000 gain in September and average monthly gains of 395,000 over the past six months (see chart below). Several provinces tightened public health restrictions last month in response to a spike in COVID-19 cases. These measures were targeted at indoor restaurants and bars, and gyms.

Most of the job gains last month were in full-time work. Among those who worked at least half their usual hours, the number working from home increased by 150,000. Working remotely continues to be an important adaptation to COVID-19 health risks, with 2.4 million Canadians who do not normally work from home doing so in October.

The unemployment rate was little changed at 8.9% in October but remained well-below the May peak of 13.7%. In addition to the unemployed, 540,000 Canadians wanted to work in October but did not search for a job, down 39,000 from September and continuing a downward trend from a peak of 1.5 million in April. If people in this group were included as unemployed, the adjusted unemployment rate in October would be 11.3%.

Long-term joblessness—defined as unemployed and looking for work or temporary layoff for 27 weeks or more— increased again in October. Not surprisingly, more than half (53.3%) of the long-term unemployed were living in a household reporting difficulty meeting necessary expenses. As of October, the long-term unemployed totalled 448,000, or one-quarter of all unemployed people. September and October increases in long-term unemployment are by far the sharpest recorded since comparable data became available in 1976.

Job Gains Slow in Central Canada

Employment increased in the wholesale and retail trade industries in Ontario, two sectors largely unaffected by new COVID-19 restrictions. After five months of gains totalling 154,000, employment in Ontario’s accommodation and food services was virtually unchanged in the month and remained 15.7% below its pre-COVID February level. Employment declined in transportation and warehousing.

Following five consecutive months of gains, employment was little changed in Quebec in October, and the unemployment rate edged up 0.3 percentage points to 7.7%. Employment gains spread across several services-producing industries were partly offset by a drop of 42,000 in the accommodation and food services industry. The public health alert level in Montréal and Québec City was raised to “red” on October 1, which led to the closure of indoor restaurants and many cultural facilities. Travel between regions in the province was also discouraged. Over the subsequent two weeks, several other Quebec regions went to red alert, and additional measures were introduced.

Employment Grows in Alberta and BC

In British Columbia, employment grew by 34,000 (+1.4%) in October, adding to gains over the previous five months (+302,000). The unemployment rate fell for the fifth consecutive month, down 0.4 percentage points to 8.0% in October. In Vancouver, employment increased by 52,000 (+3.8%) and was within 4.3% of its pre-COVID level.

In Alberta, employment rose by 23,000 (+1.1%), the fifth increase in six months. Following large employment losses earlier this year, Calgary has posted four consecutive employment gains since summer, totalling 101,000 (+13.6%). Recent employment increases in Edmonton have been more modest, up 60,000 (+9.0%) since summer.

October employment gains in Alberta were spread across several industries, including healthcare and social assistance, transportation and warehousing, and wholesale and retail trade. Employment in natural resources edged up in the month but was down 5.2% on a year-over-year basis.

Employment Increases in Newfoundland and Labrador and PEI

In Newfoundland and Labrador, employment grew (+5,900) in October, while the unemployment rate fell 2.0 percentage points to 12.8%. Employment was also up in Prince Edward Island (+900), while the unemployment rate was virtually unchanged at 10.0%.

Hard-Hit Sectors of the Economy

The accommodation and food services industry was most directly affected by the recent tightening of public health measures—and, for the first time since April, employment declined in this industry in October. Employment in the arts, entertainment, and recreation sectors was farther from pre-COVID levels than any other sector in August. The next few months will shed light on the impact of public health restrictions on employment in this sector, which, like the accommodation and food services industry, has strong ties to travel and tourism.

With restrictions on travel and gathering still in place, the continuing impact of COVID-19 has been much more significant for the transportation of people than of goods. For example, the August Survey of Employment, Payrolls and Hours found that payroll employment in transit and ground passenger transportation was down by 17.8% from February to August, while payroll employment in truck transportation—primarily for goods—was down 7.9% for the same period. Similarly, in August, major Canadian airlines carried 86.8% fewer passengers than 12 months earlier, and Canadian railways carried 14.7% less freight.

In construction, employment was little changed for the third consecutive month in October, following increases totalling 190,000 (+16.2%) from April to July. Employment in construction was 7.5% (-112,000) below its February level in October. Recent data on housing starts showed a decline of 5.0% from September 2019 to September 2020, following two months of strong year-over-year increases.

Employment Growth Resumed in Retail Trade

Following a pause in September, employment growth resumed in retail trade, rising by 31,000 (+1.4%) in October, with most of the increase in Ontario. From February to April, employment declined by over one-fifth (-22.9%; -517,000) due to retail businesses’ closures during the first wave of COVID-19. In October, public health measures associated with the second wave did not include retail businesses’ requirements to close. Employment in this industry was 5.1% (-115,000) below its pre-COVID level and down by 2.4% (-54,000) compared with October 2019.

The Winners

Employment exceeded pre-COVID levels in three industries in October—wholesale trade; professional, scientific and technical services; and educational services.

In wholesale trade, employment increased by 15,000 (+2.3%) in October, driven by Alberta increases. Employment in this industry was 5.6% (+35,000) above its February level. The wholesale trade release’s latest results show that sales increased for the fourth consecutive month in August and were 1.7% above pre-COVID-19 levels.

Employment rose for the fourth consecutive month in professional, scientific and technical services, up 42,000 (+2.7%) in October and led by Ontario (+23,000). With this gain, this industry’s employment was 3.3% (+51,000) higher than its pre-COVID level. Job security among employees in this industry includes computer systems design and related services; architecture, engineering and related services; and legal services tend to be higher than in other industries.

Employment was little changed in educational services in October but exceeded its February level by 2.8% (+39,000). Compared with October 2019, employment in this industry increased by 32,000, in part a reflection of some jurisdictions increasing staffing levels to support classroom adaptations brought on by COVID-19.

Compared with other industries, a relatively high share of workers in educational services (25.8% in 2019) is temporary employees, reflecting the relatively high prevalence of teaching staff hired on a contract basis. While the number of temporary employees decreased markedly following the initial COVID-19 economic shutdown, it had rebounded in October (little changed on a year-over-year basis, not seasonally adjusted), helping to boost overall employment in the industry. Permanent employees in educational services also contributed to the recovery of this industry on a year-over-year basis. In October, the number of permanent employees was up 5.6% compared with 12 months earlier (not seasonally adjusted).

Bottom Line 

The economic recovery remains dependent on the evolution of the pandemic. It is likely that extensive lockdown measures, such as the widespread closures imposed early in the pandemic, will not be reintroduced. However, more localized and moderate containment measures will ebb and flow. The Bank of Canada suggests that vaccines and effective treatments will be widely available by mid-2022, at which time the direct effects of the pandemic on economic activity will have ended. However, households’ precautionary behaviour and the effects of the uncertainty surrounding COVID-19 are likely to linger.

The pandemic is also likely to have persistent effects on the preferences and behaviours of consumers and businesses. This could lead to lasting changes to the economy’s structure and could weigh on its potential output. The sizes and timing of such effects are difficult to estimate precisely. Given these considerations, the outlook for Canadian and global economic activity remains unusually uncertain.

The most recent COVID Consumer Spending Tracker, produced by the RBC economics group, that second wave worries have shifted more spending online. Household, clothing, and retail spending held steady, while travel spending continued to decline. Spending on dining out edged downward last month as cooler whether rendered outdoor dining less appealing. Entertainment expenditures ticked downward as well.

The regional real estate boards in Vancouver, Toronto and Montreal recently released their October housing reports showing continued sales activity and upward price prices except in the condo space, particularly smaller condos that were bought on spec for the rental market. With the nosedive in tourism, the short-term rental market has collapsed. Many of these former Airbnb properties are either for sale or have moved into the long-term rental space, driving down prices. The dearth of immigration this year has also exacerbated the decline in rent. Condo listings are rising faster than sales in many regions. In contrast, lower rise properties remain in very tight supply, and prices continue to rise. We will provide more details on housing trends with the release of the CREA data late next week.

Dr. Sherry Cooper
Chief Economist, Dominion Lending Centres
drcooper@dominionlending.ca


BoC UPDATE: BANK OF CANADA HOLDS OVERNIGHT RATE AT 0.25% AND RECALIBRATES BOND-BUYING PROGRAM

General Mark Goode 29 Oct

Bank of Canada Recalibrates Quantitative Easing

As expected, the Bank held its target overnight rate at the effective lower bound of 25 basis points with the clear notion that negative policy rates are not in the cards. Instead, the central bank will continue to rely on large-scale asset purchases–quantitative easing (QE). The central bank is recalibrating its QE program as promised in recent weeks. In mid-October, it announced that it would end its Repo, Bankers Acceptance and Canada Mortgage Bond purchases this month, as they are no longer needed to assure liquidity in those markets. The volumes of purchases have declined sharply since April. This move will have minimal impact on market interest rates.

The Governing Council announced today it would also gradually reduce purchases of federal government bonds from at least $5 billion to at least $4 billion per week. “The Governing Council judges that, with these combined adjustments, the QE program is providing at least as much monetary stimulus as before.”

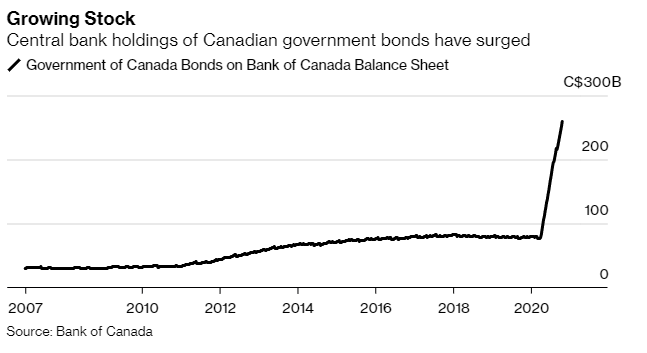
The PC opposition party has been warning Governor Macklem of the risks of financing Trudeau’s government spending. But the Bank has little alternative but to step-up its buying of newly issued benchmark bonds–those currently being sold by the government, as opposed to older debt that is becoming increasingly illiquid. As reported in Bloomberg News, “It means the bank’s quantitative easing program will increasingly mirror government debt sales at a time when opposition lawmakers are warning it against directly financing Prime Minister Justin Trudeau’s fiscal agenda.” (See chart below). The Bank already owns more than a third of all outstanding Government of Canada debt, proportionately more than most central banks because Canada ran budget surpluses, which paid down debt for so long.

Virtually every major central bank in the world is conducting an emergency QE program in response to the COVID-19 crisis. The Bank of Canada says its QE program reinforces its commitment to hold interest rates at historic lows over the next few years until the annual inflation rate is sustainably at its target 2% level. Today’s October Monetary Policy Report indicates they will likely keep the overnight rate at 0.25% until 2023.

The central bank has no intention of paring back stimulus, with risks to the economy growing amid the second wave of COVID-19 cases. “As the economy recuperates, it will continue to require extraordinary monetary policy support,” the bank said. “We are committed to providing the monetary policy stimulus needed to support the recovery and achieve the inflation objective.”

October Monetary Policy Report

  • Following the sharp bounce back in growth that occurred when containment measures were lifted, and the economy reopened, the Canadian economy transitioned to a slower, more protracted recuperation phase of its recovery. The recovery phases are proceeding largely as described in the July Report, though the initial rebound was stronger than expected. Furthermore, the near-term slowing in the recuperation phase is likely to be more pronounced due to the recent increase of COVID-19 infections.
  • There is ongoing and significant slack in the Canadian economy. The gap between the actual output and the economy’s potential output is not expected to close until 2023. The economy is progressing unevenly, with some sectors and workers disproportionately affected by the virus–particularly those in accommodation, food, arts, entertainment and recreation, as well as global transportation. Many of those hardest-hit are low-income workers.
  • Oil prices remain below pre-pandemic levels and are assumed to remain around current levels, hitting Alberta hard.
  • Ongoing slack in the economy is expected to continue to hold inflation down into 2023.

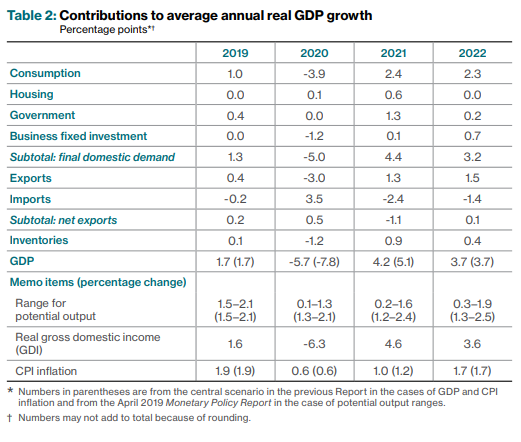
The Bank of Canada’s forecast for Canadian growth is shown in the table below. The economic recovery is projected to be prolonged, underpinned by policy support but largely influenced by the evolution of the virus, ongoing uncertainty and structural changes to the economy. These changes could result in longer-term shifts of workers and capital across different regions and sectors of the economy. This adjustment process weighs on the Bank’s estimates of potential growth.

After declining by about 5 1/2 percent in 2020, the economy is expected to expand by almost 4 percent on average in 2021 and 2022. Two factors will likely lead to quarterly patterns of growth that are unusually choppy: localized outbreaks and containment measures and varied recovery rates across industries.

Inflation is expected to remain below the lower end of the Bank’s inflation-control target range of 1 to 3 percent until early 2021, largely due to the effects of low energy prices. Subsequently, inflation is anticipated to be within the target range, but economic slack will continue to put downward pressure on inflation throughout the projection period.

The Reopening Phase Was Strong But Uneven

Growth is estimated to have rebounded strongly in the third quarter, reversing about two-thirds of the decline observed in the first half of the year.  A sizable bounce back in activity resulted from a rebound in foreign demand, the release of pent-up demand for housing and some durable goods, and robust policy support.

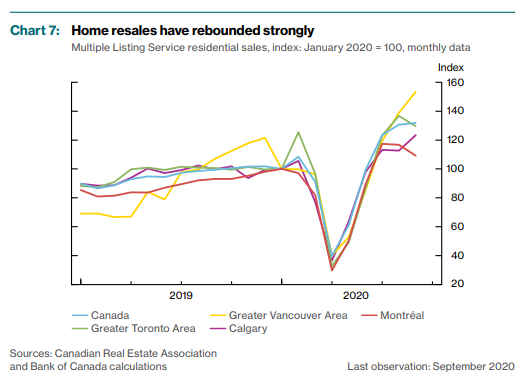
Housing activity recovered sharply in the third quarter, supported by historically low financing costs, resilient incomes for higher-earning households, and extra sales and construction that made up for delayed spring activity (Chart 7). By September, cumulative resales are estimated to have compensated for the missed activity during the normally busy spring market. Housing activity may also be benefiting from changes in preferences. In particular, more than one-quarter of respondents to the Canadian Survey of Consumer Expectations in the third quarter of 2020 reported they would like to move to a larger or single-family home because of the pandemic. The strength of the housing market recovery, combined with a tight resale market, has led to the rapid growth of house prices in some markets. In contrast to the appreciation of house values observed in Toronto and Vancouver in 2016, price growth has been strongest in markets with moderate loan-to-income ratios, such as Ottawa, Montréal and Halifax.

Bottom Line

Interest rates will remain low for the foreseeable future. The pandemic will largely determine the growth of the economy and the government’s response. Experts suggest that this second wave will last for much of the winter and that a widely dispersed vaccine will not be available until at least well into 2021. As tough as that is to take, Canada is still doing a better job of containing the virus than the US, UK and the Euro area. Output is likely to remain below pre-pandemic levels everywhere through the end of 2022, the Bank of Canada’s forecast horizon.

MORTGAGE NEWS: Bank of Canada Discontinues Some Liquidity Operations

General Mark Goode 29 Oct

Bank of Canada Will Stop Buying Canada Mortgage Bonds

This Wednesday, the Bank of Canada will release its interest rate announcement and the October Monetary Policy Report. Most people expect the overnight rate to remain at 0.25%, where it has been since the pandemic hit. A few have suggested that the Bank could take a page from Australia and reduce overnight rates by 15 basis points. I don’t think so.

Canada’s economy is not as similar to Australia’s as you might think. Yes, both countries speak mostly English, are commodity exporters, and have a currency called the dollar. But that is where the similarities end. Australia is largely a supplier to China and East Asia, while the US dominates Canada’s exports. And our major resource is oil rather than metals. Most importantly, the Bank of Canada believes that lower rates would not be helpful, given the squeeze they put on the banking system’s workings.

The Bank has committed to staying at 0.25% until economic conditions would be consistent with a sustained 2% inflation rate. With the second wave of COVID cases and rolling shutdowns upon us, the economic rebound will slow in the coming quarters. Moreover, it is unlikely we will see inflation averaging above 2% or higher through 2022. The base case forecast for overnight rates by the Bank of Canada will remain at 0.25% until 2023 unless we see a miraculous end to the pandemic far sooner than most experts predict.

Where the Bank will make policy changes is in quantitative easing–the buying of financial assets to improve liquidity in financial markets. The Bank’s Governing Council has, for months, hinted at the need for the current structure of the QE program to be “calibrated.” While there have been few details on what this means, we interpret it to imply a move away from a QE program supporting ‘market-functioning’ to one that attempts to achieve a ‘monetary policy objective.’ To some degree, this has already started.

On October 15, the Bank announced it would retire the Repo purchase program, the Bankers’ Acceptance purchase Facility and the Canadian Mortgage Bond Purchase Program (CMBP). These areas of the Canadian fixed income market are fully functioning at present, and the Bank likely felt ongoing support was no longer necessary. The end of the CMBP got the attention of some mortgage market participants who argued it spelled the end of declining mortgage rates. I think this is a misinterpretation of the Bank’s actions.

As the chart below shows, the use of the CMBP has waned considerably since its introduction in March. It just isn’t needed any longer to assure liquidity in the CMB market. Since August, lenders have only been using about $70 to $190 million per week of the BoC’s $500 million capacity. The last time lenders fully utilized, it was in April when the emergency program was clearly needed. Ending this program should have little impact on mortgage rates.

“As overall financial market conditions continue to improve in Canada, usage in several of the Bank of Canada’s programs that support the functioning of key financial markets has declined significantly,” the Bank said in announcing the changes. The program, designed to provide much-needed liquidity to the banking system to keep credit flowing during the worst of the crisis, has “fallen into disuse as the stresses from the pandemic eased, and markets became much more self-sufficient.” 

The move follows the bank’s decision a month ago to reduce its purchases of federal government treasury bills and similar short-term provincial money market debt, citing improvements in the health of short-term funding markets.

The CMB purchase program is also dwarfed by the Bank’s Government Bond Purchase Program (GBPP), as the chart below shows. “The central bank has pledged repeatedly that it will maintain the highest-profile of its emergency asset-buying programs – its minimum $5-billion-a-week purchases of Government of Canada bonds – until the [economic] recovery is well underway. It has also so far maintained its two programs to purchase provincial and corporate bonds, even though both programs’ demand has been far below original expectations.

Mortgage rates in Canada have an 85% correlation with the 5-year Government of Canada bond yield, which has fallen sharply over the course of the pandemic crisis.

Bottom LineOf the three programs being wound down in the bank’s latest announcement, the biggest is the expanded term repo program, under which the central bank has purchased more than $200-billion of the short-term bank financing instruments since mid-March. The program hasn’t generated any purchases since mid-September.

The Bankers’ Acceptance Purchase Facility, involving short-term credit instruments typically used in international trade financing, was used heavily when introduced in March. Still, it hasn’t been tapped at all since late April. The central bank made about $47-billion in purchases under the program. However, all of those purchased assets have since reached maturity, meaning the central bank is no longer holding any bankers’ acceptances on its balance sheet.

The Canada Mortgage Bond Purchase Program predates the pandemic, but the Bank of Canada ramped up its purchases dramatically during the crisis. Since mid-March, it has accumulated about $8-billion of the bonds under its emergency measures through twice-weekly purchases directly from Canada Mortgage and Housing Corp. The size of the bank’s typical purchases in the past couple of months has been less than a quarter of what it was routinely buying in the spring.

These changes in the QE program will have little impact on interest rates and mortgage markets.

DLC UPDATE: STRONGER-THAN-EXPECTED CANADIAN JOBS REPORT IN SEPTEMBER

Latest News Mark Goode 14 Oct

Canada Has Recouped Three-Quarters Of Pandemic Job Losses

The September Labour Force Survey, released this morning by Statistics Canada, reflects labour market conditions during the week of September 13 to 19, six months after the onset of the COVID-19 economic shutdown. As Canadian families adapted to new back-to-school routines at the beginning of September, public health restrictions had been substantially eased across the country, and many businesses and workplaces had re-opened. Throughout the month, some restrictions were re-imposed in response to increases in the number of COVID-19 cases. In British Columbia, new rules and guidelines related to bars and restaurants were implemented on September 8. In Ontario, limits on social gatherings were tightened for the hot spots of Toronto, Peel and Ottawa on September 17 and the rest of the province on September 19.

Employment gains unexpectedly accelerated in September, increasing by 378,200, more than double the consensus forecast on a broadly based pickup in hiring. This was the fifth consecutive month of job gains, which has now retraced three-quarters of the 3 million jobs lost during March and April. The unemployment rate fell from 10.2% in August to 9.0% in September. Most economists had expected a job gain of 150,000 and a jobless rate of 9.8%.

Another piece of good news is that most of the net new jobs were in full-time work. The number of Canadians who were employed but worked less than half their usual hours for reasons likely related to COVID-19 fell by 108,000 (-7.1%) in September.

September gains brought employment to within 720,000 (-3.7%) of its pre-COVID February level. The accommodation and food services (-188,000) and retail trade (-146,000) industries remained furthest from full recovery, while youth employment was 263,000 (-10.3%) below February levels.

Among Canadians who worked most of their usual hours, the proportion working from home edged down from August to September, from 26.4% to 25.6%.

Employment increased in every province except New Brunswick and Prince Edward Island in September, with the largest gains in Ontario and Quebec.

As a result of the COVID-19 economic shutdown, the unemployment rate more than doubled from 5.6% in February to a record high of 13.7% in May. The 9.0% jobless rate in September marks a rapid improvement.  By comparison, during the 2008/2009 recession, the unemployment rate rose from 6.2% in October 2008 to peak at 8.7% in June 2009. It then took approximately nine years to return to its pre-recession rate.

Employment in accommodation and food services rose by 72,000 (+7.4%) in September. This was the fifth consecutive monthly increase and brought total gains since the initial easing of COVID-19 restrictions in May to 427,000. Nevertheless, this industry’s employment was the furthest from recovery in September, down 15.3% (-188,000) from its pre-pandemic February level.

The accommodation and food services industry is likely to continue to face many challenges over the coming months. While outdoor dining is likely to become impractical during the winter months and as some COVID restrictions are re-introduced, a recent study indicated that Canadians plan to reduce spending at restaurants.

Following four months of increases, employment in retail trade held steady in September. Compared with February, employment in this industry was down by 146,000 (-6.4%). After increasing sharply in May and June, following the initial easing of COVID-19 restrictions, retail sales slowed markedly in July.

IN CONSTRUCTION, A LONG ROAD TO RECOVERY REMAINS.

Employment in construction remained little changed for the second consecutive month in September and was down by 120,000 (-8.1%) compared with its pre-COVID level. Compared with February, employment in construction was down the most in Ontario (-54,000; -9.5%) and British Columbia (-39,000; -16.3%).

Construction consists of three subsectors: construction of buildings, heavy and civil engineering construction, and specialty trade contractors. According to the latest results from the Survey of Employment Payrolls and Hours, employment in construction fell from February to July in each of these subsectors, with the largest decline among specialty trade contractors. The release of investment in building construction for July showed that investment in building construction was slightly lower in July than in February.

MANUFACTURING EMPLOYMENT ALMOST FULLY RECOVERED, BUT LAGGING IN ALBERTA.

While some industries face a long recovery to pre-COVID employment levels, some sectors—including manufacturing—have almost fully recovered.

The pace of employment growth in manufacturing picked up in September (+68,000; +4.1%), following two months of modest growth over the summer. The September gains brought the total employment change in this industry to a level similar to that of February. While employment in manufacturing remained well below pre-pandemic levels in Alberta (-17,000; -12.1%) and to a lesser extent in Quebec (-15,000; -3.1%), employment was above the pre-COVID level in Ontario (+17,000; +2.3%).

EMPLOYMENT IN EDUCATIONAL SERVICES RISES IN SEPTEMBER AND SURPASSES PRE-COVID LEVELS.

Employment in educational services grew by 68,000 (+5.0%) in September, led by Ontario and Quebec. After declining by 11.5% from February to April, employment in the industry has increased for five consecutive months and has reached a level 2.6% higher than in February.

As students returned to school in August and September, some jurisdictions increased staffing levels to support classroom adaptations. On a year-over-year basis, employment in educational services was up by 32,000 (+2.3%) in September, driven by an increase in elementary and secondary school teachers and educational counsellors (not seasonally adjusted).

Bottom Line 
The labour market impact of the COVID-19 economic shutdown has been particularly severe for low-wage employees (defined as those who earned less than $16.03 per hour, or two-thirds of the 2019 annual median wage of $24.04/hour). From February to April, employment among low-wage employees fell by 38.1%, compared with a decline of 12.7% for all other paid employees (not seasonally adjusted).

Almost half of the year-over-year decline in low-wage employees in September was accounted for by three industries: retail trade; accommodation and food services; and business, building and other support services industries.

The pandemic has disproportionately hit low-wage workers and youth, explaining why housing activity has been so strong. Low-wage employees and youth are typically not homebuyers or sellers.

Moreover, the RBC COVID Consumer Spending Tracker for the week of October 5 shows that spending trends continued solid with few signs of second-wave worries impacting consumer confidence yet.

According to RBC:

  • “Among retail categories, clothing spending continued to climb, returning to year-ago levels.
  • Spending on apparel, gifts, and jewelry was up 1.5% relative to last year.
  • Other retail categories held on to gains from the past few months.
  • Despite plateauing in dollar terms, entertainment spending ticked up relative to last year.
  • During the summer, high golf spending likely continued into early fall— rather than slowing down as it would have in a normal year.
  • Slower spending on accommodation and car rentals accelerated a downward trend in travel-related purchases that have dominated in the last several weeks.
  • Travel spending had recovered partially from pandemic lows; it was still down about 60% in peak summer. It worsened again as the weather cooled.
  • Simultaneously, automotive spending fell slightly, in line with seasonal trends, as the summer road trip season came to an end.
  • Labour Day saw the strongest restaurant spending since before the pandemic, but the uptick was fleeting.
  • Spending on dining out quickly fell back to -6% relative to a year ago, a level it’s hovered around since July.”

Recently released data from the real estate boards in Toronto and Vancouver showed strong sales activity and significant further upward pressure on prices. In the GTA, a surge in new listings of high-rise condos meant that the upward pressure on home prices was driven by the ground-oriented market segments, including detached and semi-detached houses and townhouses. Home sales and new listing activity reached record levels in Metro Vancouver last month. The heightened demand from home buyers is keeping overall supply levels down. This is creating upward pressure on home prices, which have been edging up since the spring.

The CREA data for the whole country will be out on the 15th of October. This adjusts the price data for types of homes sold, giving us a better idea of how significant price pressures have been and in which sectors—more on that next week. 

Dr. Sherry Cooper

DR. SHERRY COOPER

Chief Economist, Dominion Lending Centres
Sherry is an award-winning authority on finance and economics with over 30 years of bringing economic insights and clarity to Canadians.

More Posts – Website

Follow Me:
TwitterFacebook

DLC UPDATE: ANOTHER RECORD-SETTING MONTH FOR CANADIAN HOUSING

General Mark Goode 16 Sep

CANADIAN HOUSING MARKET SETS RECORD HIGHS IN AUGUST

Today’s release of August housing data by the Canadian Real Estate Association (CREA) showed a blockbuster August with both sales and new listings hitting their highest levels in 40 years of data–exceeding the record July activity levels. This continues the rebound in housing that began four months ago.

National home sales rose a further 6.2% on a month-over-month (m-o-m) basis in August, raising them to another new all-time monthly record (see chart below).

Unlike the previous two months in which activity was up right across the country, sales in August were up in about 60% of local markets. Gains were led by the Greater Toronto Area (GTA) and British Columbia’s Lower Mainland. With ongoing supply shortages in so many parts of Canada, it is interesting to note that the GTA and Lower Mainland also saw a considerable amount of new supply become available in August.

Actual (not seasonally adjusted) sales activity posted a 33.5% y-o-y gain in August. It was a new record for the month of August, and the sixth-highest monthly sales figure of any month on record. Transactions were up compared to last August in almost all Canadian housing markets.

So far this year, over 340,000 homes have traded hands over the Canadian MLS Systems, which was up 0.8% from the same period in 2019 despite the COVID-19 pandemic-induced recession.

“It has been a record-setting summer in many housing markets across Canada as REALTORS® and their clients play catch up following the loss of so much of the 2020 spring market,” stated Costa Poulopoulos, Chair of CREA. “Many markets dealing with inventory shortages have been seeing fierce competition among buyers this summer; although, that was something that had been anticipated for 2020 prior to COVID-19. It really does seem that the spring market shifted into the summer”.

According to Shaun Cathcart, CREA’s Senior Economist, “Activity shows signs of moderating in September”.

New Listings

The number of newly listed homes posted a further 10.6% gain in August compared to July. New supply was up in close to three-quarters of local markets, led by gains in the Lower Mainland, GTA and Ottawa.

With the August increase in new supply outpacing the rise in sales for the first time since the rebound began in May, the national sales-to-new listings ratio eased to 69.4% in August compared to 72.3% posted in July. That said, it was still among the highest levels on record for this measure.

Based on a comparison of sales-to-new listings ratio with long-term averages, only about a third of all local markets were in balanced market territory, measured as being within one standard deviation of their long-term average. The other two-thirds of markets were above long-term norms, in many cases well above.

The number of months of inventory is another important measure of the balance between sales and the supply of listings. It represents how long it would take to liquidate current inventories at the current rate of sales activity.

There were just 2.6 months of inventory on a national basis at the end of August 2020 – the lowest reading on record for this measure. At the local market level, a number of Ontario markets are now into weeks of inventory rather than months. So supply constraints are still prevalent in many parts of the country, especially in Ontario.

Home Prices

The Aggregate Composite MLS® Home Price Index (MLS® HPI) rose by 1.7% m-o-m in August 2020 (see chart and table below). This compares to a 2.3% m-o-m jump in July 2020 – the second largest increase on record (after March 2017) going back 15 years. Of the 21 markets currently tracked by the index, m-o-m gains were posted everywhere but Victoria and elsewhere on Vancouver Island.

The non-seasonally adjusted Aggregate Composite MLS® HPI was up 9.4% on a y-o-y basis in August – the biggest gain since late 2017.

The largest y-o-y gains were recorded in Ottawa (+19.9%) and Montreal (+16.4%), followed by increases in the 10% – 15% range in the GTA and surrounding Greater Golden Horseshoe markets. Moncton prices were also up in that range in August.

Prices were fairly flat on a y-o-y basis in Calgary, Edmonton and St. John’s, while climbing in the 3.5% – 5.5% range across B.C.

The MLS® HPI provides the best way to gauge price trends because averages are strongly distorted by changes in the mix of sales activity from one month to the next.

The actual (not seasonally adjusted) national average home price set another record in August 2020 at more than $586,000, up 18.5% from the same month last year.

Bottom Line

CMHC forecasted back in May that the national average sales prices will fall 9%-to-18% in 2020 and not return to yearend-2019 levels until as late as 2022. Instead, the national average sales price as of August has posted a 18.5% gain.

Housing strength is largely attributable to pent-up demand by households that have maintained their level of income during the pandemic. The hardest-hit households are low-wage earners in the accommodation, food services, and travel sectors. These are the folks that can least afford it and typically are not homeowners.

The good news is that the housing market is contributing to the recovery in economic activity.  


CMHC Annual Residential Mortgage Industry Report

The Residential Mortgage Industry report provides an in-depth view of the residential mortgage market in Canada: from mortgage origination to funding, covering insured and uninsured mortgages, and encompasses activity from all mortgage lender types. It is based on data available at the end of the second quarter of 2020. The following are key highlights:

Mortgage lender type trends

  • The report shows that in 2019, Canada’s big six banks maintained their strong foothold in the housing finance market, with a 67% market share of newly extended mortgages (see chart below).
  • Mortgage Finance Companies (MFCs) hold 20% of the insured mortgage space and credit unions stand at 12%.
  • Mortgage delinquencies of 90 days or more remained at low levels for all mortgage lender types, which suggests that a steady share of mortgage holders continued to be able to make their payments or were able to defer their mortgage payments.
  • MICs continued to represent 1% in nationwide outstanding mortgages, valued at approximately between $14 billion and $15 billion in mortgage debt.
  • Some MICs offered mortgage deferrals and other types of accommodations to financially strained mortgage consumers. An estimated 10% of mortgage consumers asked for a mortgage deferral.

Mortgage Funding Trends

  • Deposits continued to be the primary source of mortgage funding for the big six banks (66%) and credit unions (77%).
  • Covered bonds made up 17% of total mortgage funding for Canada’s big six banks at the end of the first quarter of 2020, representing an increase of 4% from 2019.
  • Private securitization continued to account for a very small share of the mortgage funding mix in Canada, with just 1.1%. However, the residential mortgage-backed securities market appears to be expanding.


Dr. Sherry Cooper

DR. SHERRY COOPER

Chief Economist, Dominion Lending Centres
Sherry is an award-winning authority on finance and economics with over 30 years of bringing economic insights and clarity to Canadians.

More Posts – Website

Follow Me:
TwitterFacebook

DLC UPDATE: Strong August Jobs Report in Canada

Latest News Mark Goode 4 Sep

Canada Has Recouped Two-Thirds Of Pandemic Job Losses

The August Labour Force Survey, released this morning by Statistics Canada, reflects labour market conditions as of the week of August 9 to 15, five months after the onset of the COVID-19 economic shutdown. By mid-August, public health restrictions had substantially eased across the country and more businesses and workplaces had re-opened.

Employment rebounded in August by 246,000 net new jobs, a slowdown from the 419,000 gain in July and June’s 953,000 rise. This slowdown was expected with the initial recovery boost from easing containment measures in the spring fading through the summer.

The great news is that 84% of the headline jobs gain in August was in full-time positions. This follows the surge in part-time jobs in July. Full-time employment stood at 93.9% of pre-pandemic levels in August, compared with 96.1% for part-time work. In the months prior to the COVID-19 economic shutdown, full-time employment had reached record highs, while growth in part-time work was relatively flat. Compared with 12 months earlier, full-time employment was down 5.4% in August, while part-time work decreased by 5.1%. And an elevated share of those working part-time is doing so despite preferring full-time work. Hours worked increased more than employment in August–but are still down more relative to pre-shock February levels (-8.6%) than the headline employment count (-5.7%).

The August job growth brought employment to within 1.1 million of its pre-COVID February level, thereby recouping two-thirds of all the lost jobs.

The number of Canadians who were employed but worked less than half their usual hours for reasons likely related to COVID-19 fell by 259,000 (-14.6%) in August. Combined with declines in May, June and July, this left COVID-related absences from work at 713,000 (+88.3%) above February levels.

As of the week of August 9 to 15, the total number of Canadian workers affected by the COVID-19 economic shutdown stood at 1.8 million. In April, this number reached a peak of 5.5 million, including a 3.0 million drop in employment and a 2.5 million increase in COVID-related absences from work.

The number of Canadians working from home declined for the fourth consecutive month. In April, at the height of the COVID-19 economic shutdown, 3.4 million Canadians who worked their usual hours had adjusted to public health restrictions by beginning to work from home. This number has fallen each month since May when the gradual easing of public health restrictions began and reached 2.5 million in August.

Among Canadians who worked their usual hours in August, the total number working from home fell by nearly 300,000 compared with July, while the number working at locations other than home increased by almost 400,000.

THE JOBLESS RATE CONTINUED TO FALL IN AUGUST

The unemployment rate fell 0.7 percentage points to 10.2% in August. As a result of the COVID-19 economic shutdown, the unemployment rate had surged from 5.6% in February to a record high of 13.7% in May. By way of comparison, during the 2008/2009 recession, the unemployment rate rose from 6.2% in October 2008 and reached a peak of 8.7% in June 2009. It took approximately nine years before it returned to its pre-recession rate.

The unemployment rate fell most sharply in August among core-aged women aged 25 to 54 years old, down 1.2 percentage points to 7.5%, the lowest unemployment rate among all major groups. This decline was largely due to employment increases, as overall labour force participation was unchanged from July. The unemployment rate for core-aged men fell 0.7 percentage points to 8.1%, also the result of increased employment, with little change in their labour market participation.

Employment gains in the services sector continued to outpace that of the goods-producing sector. Employment growth in the services sector was driven by gains in educational services, accommodation and food services and the “other services” industry. In the goods sector, gains in manufacturing were partially offset by declines in natural resources.

Accommodation and food services as well as retail trade were among the industries hardest hit by the initial COVID-19 economic shutdown. By April, employment had fallen to half (-50.0%) of its pre-pandemic level in accommodation and food services and to 77.1% of its pre-COVID-19 level in retail trade. Starting in May, employment rebounded in both sectors as many provinces began reopening their economy.

Employment growth in accommodation and food services rose by 18.4% per month on average from May to July. In August, however, the pace of growth in the industry slowed to 5.3% (+49,000). Despite these recent gains, employment in accommodation and food services was at 78.9% of its February level. August marked the fifth full month of international travel restrictions, which continues to affect industries with strong ties to tourism.

The number of people employed in retail trade edged up 0.7% (+14,000) in August, following average monthly increases of 6.3% over the previous three months. Employment in retail trade reached 93.4% of its pre-COVID-19 level but fell just below the rate of recovery for total employment (94.3%).

While employment remained below pre-COVID-19 levels, retail sales in June were higher than in February and are expected to continue to rise in July, based on preliminary estimates. This highlights potential structural changes within the industry as employers have been able to increase their sales despite a smaller workforce.

Employment Increased in Most Provinces in August–Led by Ontario and Quebec

Employment in Ontario rose by 142,000 in August (+2.0%), nearly all in full-time work, while the unemployment rate fell by 0.7 percentage points to 10.6%. Combined with the employment increases in June and July (+529,000), the gains in August brought employment in Ontario to within 93.6% of its pre-pandemic level.

In the census metro area (CMA) of Toronto, employment increased by 121,000 (+3.8%), nearly double the growth rate of the province, and reached 93.3% of its pre-pandemic level.

In Quebec, employment increased by 54,000 (+1.3%) in August, building on gains of 576,000 over the previous three months, and bringing employment in the province to within 95.7% of its pre-COVID level.

In the Montréal CMA, employment grew by 38,000 (+1.8%) in August and reached 96.0% of its pre-pandemic level.

Employment rose in most Western provinces in August. British Columbia reported the largest increase, up 15,000 (+0.6%). Employment reached 94.1% of its February level and the unemployment rate fell 0.4 percentage points to 10.7%.

While employment in Alberta was little changed, the unemployment rate declined by a full percentage point to 11.8% as fewer people looked for work.

In Atlantic Canada, Nova Scotia had the largest employment gain in August, up 7,200 (+1.6%), mostly in part-time work. The unemployment rate was little changed at 10.3%, as more Nova Scotians participated in the labour market. After notable increases in May and June, employment in New Brunswick held steady for the second consecutive month.

Bottom Line 

This was still a relatively strong employment report even though job gains have slowed. Canada’s employment recovery has outpaced the US, recouping two-thirds of the lost jobs compared to only a 50% gain south of the border. The hardest-hit has been both low-wage workers and youth, which helps to explain why housing activity has been so strong. Low-wage employees and youth are typically not homebuyers or sellers. Moreover, consumer spending in Canada has solidified very near to pre-COVID levels. Spending on entertainment, dining and self-care has risen recently as more businesses open up and is now approaching year-ago levels. Total credit or debit card spending is up about 5% relative to the same time last year. Canadians are venturing out more around their home towns, but not going much further.

According to RBC:

  • “While online spending remained prevalent in some areas (e.g., groceries), in-person transactions continued to recover.
  • Spending indicates Canadians were comfortable going out to dinner, even if to a patio. Restaurant spending was buoyed by Canadians seeking in-person dining experiences and was down just over 4% from last year’s level.
  • The share of online transactions at restaurants decreased to 17% from one-third at its post-crisis peak.
  • Health and self-care spending increased through mid-August, as gym reopening’s led to an uptick in fitness spending.
  • Entertainment spending picked up further into August and was down 10% relative to last year.
  • Spending was supported by still-strong spending on golf and to a lesser degree digital goods.
  • More recently, Canadians began spending again on professional sports, lotteries, hobbies, and local attractions.”

Recent data from the local real estate boards in Toronto and Vancouver showed strong sales activity and significant further upward pressure on prices. The CREA data for the whole country will be out on the 15th of September. This adjusts the price data for types of homes sold, giving us a better idea of how significant price pressures have been. 

Dr. Sherry Cooper

DR. SHERRY COOPER

Chief Economist, Dominion Lending Centres
Sherry is an award-winning authority on finance and economics with over 30 years of bringing economic insights and clarity to Canadians.

More Posts – Website

Follow Me:
TwitterFacebook

OFFICE UPDATE: EFFECTIVE MONDAY, AUGUST 31, 2020

General Mark Goode 3 Sep

Effective Monday August 31, #MortgageManDLC will be open for both scheduled AND walk-in appointments. All incoming clients will be subject to COVID-19 screening questions and face masks continue to be mandatory for ALL who enter our office.

Please note the following:

  • IF YOU NEED TO SPEAK TO US ABOUT YOUR MORTGAGE:  Please call  705-326-8523, OR e-mail mark@markgoode.ca for inquiries or to arrange an appointment, or visit us at 180 Memorial Ave.
  • SUBMIT YOUR DOCUMENTS: e-mail  mark@markgoode.ca, fax  705-326-8645, DocuSign, our Velocity Client Portal, or our drop slot to the right of our front door .

Thank you to everybody for your cooperation during this time!

DLC UPDATE: Canadian Q2 GDP Growth Plunge–Rebounds Since April

Latest News Mark Goode 28 Aug

Canadian Economy Took a Record Nosedive in Q2

Canadian real GDP plunged 11.5% in the second quarter, or -38.7% at an annualized rate, the worst quarterly decline on record (see chart below). This followed an 8.2% plunge in Q1. The worst of the contraction occurred early in the quarter as the lockdown in March and April wreaked havoc on activity. Since then, the economy has shown surprisingly strong signs of recovery.

StatsCan revealed today that GDP rose 6.5% in June following the 4.8% rise in May and an estimated 3.0% growth in July. Even so, Canada’s recovery is expected to be bumpy and long. No doubt, not all businesses and sectors will expand in sync, and not all jobs will be recovered.

One of the brightest spots in the recovery has been housing, where activity surged in July, reflective of record-low mortgage rates and pent-up demand. Apparently, many homebound Canadians are reassessing their housing needs. Demand for increased space, especially in the suburbs or exurbs, has been robust.

Virtually every sector of the economy was battered in Q2. Household spending dived 43% while business investment collapsed at a 57% annual rate. Virus containment weighed on both, with a fall in oil prices exacerbating the decline in oil & gas investment. Net exports were the only sector that added to economic activity, but only because imports fell more than exports as housebound consumers and shuttered businesses had little need for imported products.

On a year-over-year basis, the monthly rise in June and July will leave GDP down a much milder 5%, but still worse than the -4.7% drop during the financial crisis. The surge in June–itself a record bounce–reflects the gradual re-opening of the economy, with retail, wholesale and manufacturing leading the way. Retail trade jumped 22.3% in June, surpassing its pre-pandemic level of activity. Motor vehicle dealers contributed most to growth.

Following a 17.3% jump in May, the construction sector rose 9.4% in June as a continued easing of emergency restrictions across the country contributed to the return to nearly normal levels of activity at construction sites. Residential construction grew 7.1% as increases in multi-unit dwellings construction and home alterations and improvements more than offset lower single-unit construction. Non-residential construction rose 11.0%, surpassing the pre-pandemic level of activity, as all three components were up.

Real estate and rental and leasing grew 2.5% in June. Activity at the offices of real estate agents and brokers jumped 65.2% in the month, following a 56.4% increase in May, as home resale activity in all major urban centres saw double-digit increases. The output of real estate agents and brokers was about 7% below February’s pre-pandemic level, but other data show it was up sharply in July, hitting new record highs.

GOVERNMENT PROVIDED A MUCH-NEEDED CUSHION 

Household disposable income surged last quarter despite the pandemic thanks to government income support (see chart below). The rise in income, coupled with the massive decline in consumer spending as well as the deferral of mortgage payments for many triggered a surge in the savings rate. The household saving rate jumped to 28.2% from 7.6% in the prior quarter. Savings rates, of course, are generally higher for higher income brackets.

BOTTOM LINE

The plunge in economic activity in the second quarter–though awful–was not as deep as the Bank of Canada expected (-43%) in its most recent Monetary Policy Report. As well, the rebound since the end of April has been stronger than expected, especially in the housing sector. To be sure, labour market conditions are still very soft with the jobless rate at 10.9% in July, but the new programs announced last week by the federal government to replace CERB will help ease the transition for people still looking for work.

A possible resurgence in the virus remains a risk unless an effective vaccine can be distributed. The economy will operate below capacity into the next year, but perhaps not as drastically below capacity as previously feared.

Dr. Sherry Cooper

DR. SHERRY COOPER

Chief Economist, Dominion Lending Centres
Sherry is an award-winning authority on finance and economics with over 30 years of bringing economic insights and clarity to Canadians.

More Posts – Website

Follow Me:
TwitterFacebook

DLC UPDATE: RECORD-SETTING CANADIAN HOUSING MARKET IN JULY

General Mark Goode 18 Aug

Canadian Housing Market Very Strong in July

Today’s release of July housing data by the Canadian Real Estate Association (CREA) showed a blockbuster July with both sales and new listings hitting their highest levels in 40 years of data. This continues the rebound in housing that began three months ago.

National home sales rose 26% month-over-month (m-o-m) in July, which translates to a 30.5% gain from a year ago (see chart below). July’s sales activity was the strongest for any month in history. According to Shaun Cathcart, CREA’s Senior Economist,  “A big part of what we’re seeing right now is the snapback in activity that would have otherwise happened earlier this year. Recall that before the lockdowns, we were heading into the tightest spring market in almost 20 years. Things may have gone quiet for a few months, but ultimately the market we’re seeing right now is mostly the same one we were heading into back in March. That said, there are some new factors at play as well. There are listings that will come to the market because of COVID-19, but many properties are also not being listed right now due to the virus, as evidenced by inventories that are currently at a 16-year low. Some purchases will no doubt be delayed, but the new-found importance of home, lack of a daily commute for many, a desire for more outdoor and personal space, room for a home office, etc. will certainly also spur activity that otherwise would not have happened in a non-COVID-19 world.”

For the third month in a row, transactions were up on a month-over-month basis across the country. Among Canada’s largest markets, sales rose by 49.5% in the Greater Toronto Area (GTA), 43.9% in Greater Vancouver, 39.1% in Montreal, 36.6% in the Fraser Valley, 31.8% in Hamilton-Burlington, 28.7% in Ottawa, 16.9% in London and St. Thomas, 15.7% in Calgary, 12.1% in Winnipeg, 9.7% in Edmonton and 5.4% in Quebec City.

New Listings

The number of newly listed homes climbed by another 7.6% in July compared to June, to a level of 71,879–the highest level for any July in history. New supply was only up in about 60% of local markets, as the rebound in supply appears to be tapering off in many parts of the country. The national increase in July was dominated by gains in the GTA. More supply is expected to come on the market in future months, particularly once a vaccine is widely available.

With the ongoing rebound in sales activity now far outpacing the recovery in new supply, the national sales-to-new listings ratio tightened to 73.9% in July compared to 63.1% posted in June. It was one of the highest levels on record for this measure, behind just a few months back in late 2001 and early 2002.

Based on a comparison of sales-to-new listings ratios with long-term averages, only about a third of all local markets were in balanced market territory, measured as being within one standard deviation of their long-term average, in July 2020. The other two-thirds of markets were all above long-term norms, in many cases well above.

The number of months of inventory is another important measure of the balance between sales and the supply of listings. It represents how long it would take to liquidate current inventories at the current rate of sales activity.

Housing markets are very tight, especially in Ontario, as demand has far outpaced supply. There were just 2.8 months of inventory on a national basis at the end of July 2020 – the lowest reading on record for this measure. At the local market level, a number of Ontario markets shifted from months of inventory to weeks of inventory in July.

Home Prices

The Aggregate Composite MLS® Home Price Index (MLS® HPI) jumped by 2.3% m-o-m in July 2020 – the second largest increase on record (after March 2017) going back 15 years. (see Table below). Of the 20 markets currently tracked by the index, they all posted m-o-m increases in July.The biggest m-o-m gains, in the range of 3%, were recorded in the GTA outside of the city of Toronto, Guelph, Ottawa and Montreal; although, generally speaking, most markets east of Saskatchewan are seeing prices accelerate in line with strong sales numbers. Price gains were more modestly positive in B.C. and Alberta.

The non-seasonally adjusted Aggregate Composite MLS® HPI was up 7.4% on a y-o-y basis in July the biggest gain since late 2017.

The MLS® HPI provides the best way to gauge price trends because averages are strongly distorted by changes in the mix of sales activity from one month to the next.

The actual (not seasonally adjusted) national average price for homes sold in July 2020 was a record $571,500, up 14.3% from the same month last year.

The national average price is heavily influenced by sales in the Greater Vancouver and the GTA, two of Canada’s most active and expensive housing markets. Excluding these two markets from calculations cuts around $117,000 from the national average price. The extent to which sales continue to fluctuate in these two markets relative to others could have further compositional effects on the national average price, both up and down.

Bottom Line

CMHC has recently forecast that national average sales prices will fall 9%-to-18% in 2020 and not return to yearend-2019 levels until as late as 2022. I continue to believe that this forecast is overly pessimistic. Here we are in the second half of 2020, and the national average sales price has risen 14.3% year-over-year.

The good news is that the housing market is contributing to the recovery in economic activity. While the course of the virus is uncertain, Canada’s government has handled the COVID-19 situation very well from both a public health and a fiscal and monetary perspective. The future course of the economy here will depend on the virus. While no one knows what that will be, suffice it to say that Canada’s economy is en route to a full recovery, but it may well be a long and bumpy one.

Dr. Sherry Cooper

DR. SHERRY COOPER

Chief Economist, Dominion Lending Centres
Sherry is an award-winning authority on finance and economics with over 30 years of bringing economic insights and clarity to Canadians.

More Posts – Website

Follow Me:
TwitterFacebook