Bank of Canada Responds To Mounting Inflation: Ends QE and Hastens Timing of Rate Hike

General Mark Goode 28 Oct


The Bank of Canada surprised markets today with a more hawkish stance on inflation and the economy. The Bank released its widely anticipated October Monetary Policy Report (MPR) in which its key messages were:

  • The Canadian economy has accelerated robustly in the second half.
  • Labour markets have improved, especially in the hard-to-distance sectors. Despite continuing slack, many businesses can’t find appropriate workers quickly enough to meet demand.
  • Disruptions to global supply chains have worsened, limiting production and leading to both higher costs and higher prices. 
  • The output gap is narrower than projected in July. The Bank now expects slack to be absorbed in Q2 or Q3 of next year, one quarter sooner than earlier projected.
  • Given persistent supply constraints and the increase in energy prices, the Bank expects inflation to stay above the control range for longer than previously anticipated before easing back to close to the 2 percent target by late 2022.
  • The Bank views the risks around this inflation outlook as roughly balanced.

In response to the Bank’s revised view, it announced that it is ending quantitative easing, shifting to the reinvestment phase, during which it will purchase Government of Canada bonds solely to replace maturing bonds. The Bank now owns about 45% of all outstanding GoC bonds.

The Bank today held its target for the overnight rate at the effective lower bound of 1/4 percent. While this was widely expected, the Bank adjusted its forward guidance. It moved up its guidance for the first hike in the overnight rate target by three months, from the second half of 2022 to the middle quarters–sometime between April and September.


Canadian bond traders had already bet a rate hike would occur in Q1 or Q2. Nevertheless, bond yields spiked at 10 AM today when the Bank released its policy decision (see chart below).


Bottom Line

Since the Bank last met in early September, the Government of Canada five-year bond yield has spiked from .80% by a whopping 60 basis points to a 1.40%. That is an incredible 75% rise. A year ago, the five-year bond yield was only .37%.

The Bank believes the surge in inflation is transitory,  but that does not mean it will be brief. CPI inflation was 4.4% y/y in September and is expected to rise and average around 4.75% over the remainder of this year.  Macklem now believes inflation will remain above the Bank’s 1%-to-3% target band until late next year.

There is also a good deal of uncertainty about the size of the slack in the economy. This is always hard to measure, especially now when unemployment remains elevated at 6.9%, while sectors such as restaurants and retail are fraught with labour shortages. Structural changes in the labour force are afoot. Many former restaurant employees have moved on or are reluctant to return to jobs where virus contagion risks and poor working conditions. There was also a surge in early retirements during the pandemic and a dearth of new immigrants.

Concerning housing, the MPR says the following: “Housing market activity is anticipated to remain elevated over 2022 and 2023 after having moderated from recent record-high levels. Increased immigration, solid income levels and favourable financing conditions will support ongoing strength. New construction will add to the supply of houses and should help soften house price growth.”


Canadian Home Prices Continued to Rise As Insufficient Supply Creates Excess Demand

General Mark Goode 15 Oct

Today the Canadian Real Estate Association (CREA) released statistics showing national existing-home sales rose 0.9% between August and September 2021, posting the first monthly gain since March (see chart below). On a year-over-year (y-o-y) basis, the number of transactions last month was down 17.5%. Nevertheless, it was still the second-highest sales figure ever for the month of September.

“September provided another month’s worth of evidence from all across Canada that housing market conditions are stabilizing near current levels,” said Cliff Stevenson, Chair of CREA. “In some ways that comes as a relief given the volatility of the last year-and-a-half, but the issue is that demand/supply conditions are stabilizing in a place that very few people are happy about. There is still a lot of demand chasing an increasingly scarce number of listings, so this market remains very challenging.”

Housing supply remains a major constraint, forcing many buyers to either pay up for scarce properties or to remain on the sidelines. This is particularly troublesome for first-time homebuyers as mortgage rates are coming under renewed upward pressure as inflation concerns have forced yield curves to steepen and longer-term bond yields to rise worldwide.


New Listings

Exacerbating supply problems, the number of newly listed homes fell by 1.6% in September compared to August, as gains in parts of Quebec were swamped by declines in the Lower Mainland, in and around the GTA and in Calgary.

With sales up and new listings down in September, the sales-to-new listings ratio tightened to 75.1% compared to 73.2% in August. The long-term average for the national sales-to-new listings ratio is 54.8%.

Based on a comparison of sales-to-new listings ratio with long-term averages, a small but growing majority of local markets are moving back into seller’s market territory (see chart below). As of September, it was close to a 60/40 split between seller’s and balanced markets.

There were 2.1 months of inventory on a national basis at the end of September 2021, down slightly from 2.2 months in August and 2.3 months in June and July. This is extremely low and indicative of a strong seller’s market at the national level and in most local markets. The long-term average for this measure is more than 5 months.


Home Prices

In line with tighter market conditions, the Aggregate Composite MLS® Home Price Index (MLS® HPI) accelerated to 1.7% on a month-over-month basis in September 2021.

The non-seasonally adjusted Aggregate Composite MLS® HPI was up 21.5% on a year-over-year basis in September, up a bit from the 21.3% year-over-year gain recorded in August.

Looking across the country, year-over-year price growth is creeping up above 20% in B.C., though it is lower in Vancouver (13.9%), on par with the provincial number in Victoria, and higher in other parts of the province (see table below).

Year-over-year price gains are in the mid-to-high single digits in Alberta and Saskatchewan, while gains are into the low double digits in Manitoba.

Ontario saw year-over-year price growth pushing 25% in September; however–as with B.C.–big, medium and smaller city trends, gains are notably lower in the GTA (19.0%) and Ottawa (16.4%), around the provincial average in Oakville-Milton (26.9%), Hamilton-Burlington (26.5%) and Guelph (26.4%), and considerably higher in many of the smaller markets around the province.

Greater Montreal’s year-over-year price growth remains at a little over 20%, while Quebec City is now at 12.7%. Price growth is running a little above 30% in New Brunswick (higher in Greater Moncton, a little lower in Fredericton and Saint John), while Newfoundland and Labrador is now at 12% year-over-year (a bit lower in St. John’s).


Bottom Line

Canada continues to contend with one of the developed world’s most severe housing shortages. As our borders open to a resurgence of immigration, excess demand for housing will mount. The impediments to a rapid rise in housing supply, both for rent and purchase, are primarily in the planning and approvals process at the municipal level. Liberal Party election promises do not address these issues.

It is noteworthy that while Canada suffers one of the most acute housing shortages, housing affordability is getting worse in many OECD countries (see chart below).


Adding to the affordability problem, interest rates have bottomed as an inflation-induced selloff in bonds mount despite the assertion of most central banks that inflation is temporary. Very recently, Governor Tiff Macklem admitted that inflation is likely to remain a problem until the end of the year.

Some of the inflation is coming from disruptions on the supply side emanating from COVID-related disruptions, which may work themselves out in time. However, they’re still getting worse, and many suggest the timeline could be much longer than just this year. In addition, extreme weather events and climate change initiatives–both of which are more or less permanent–have also boosted inflation pressure. Consumer demand for goods and housing and business capital expenditures have surged in the face of labour shortages. Wage rates are beginning to rise. All of this has raised prices spilling into next year. Higher interest rates are likely sustainable even though the Bank of Canada and the Federal Reserve will likely hold overnight rates steady for the next year (see charts below).


Blockbuster September Jobs Report –Further Fuel For Rising Interest Rates

General Mark Goode 8 Oct


Blockbuster September Jobs Report–Further Fuel For Rising Interest Rates


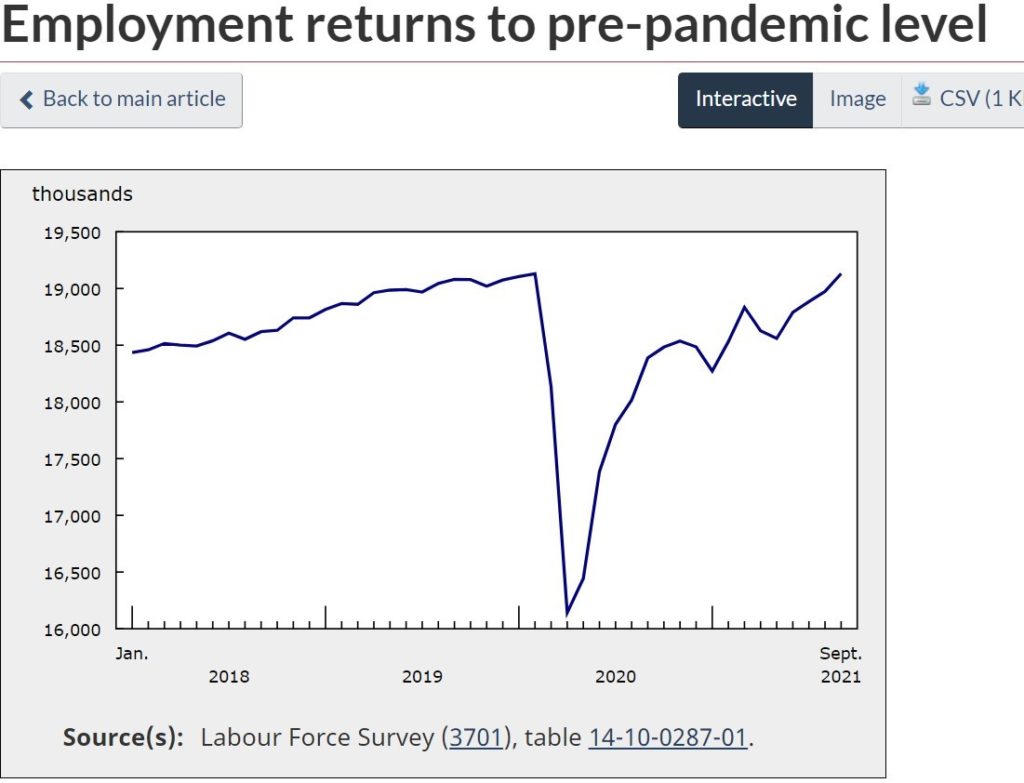
Statistics Canada released the September Labour Force Survey this morning, providing some unmitigated good news on the jobs front. Employment rose by 157,000 (+0.8%) in September, the fourth consecutive monthly increase. The unemployment rate fell by 0.2 percentage points to 6.9%.

Employment gains in September were concentrated in full-time work and among people in the core working-age group of 25 to 54. Increases were spread across multiple industries and provinces.

Employment gains in the month were split between the public-sector (+78,000; +1.9%) and the private-sector (+98,000; +0.8%).

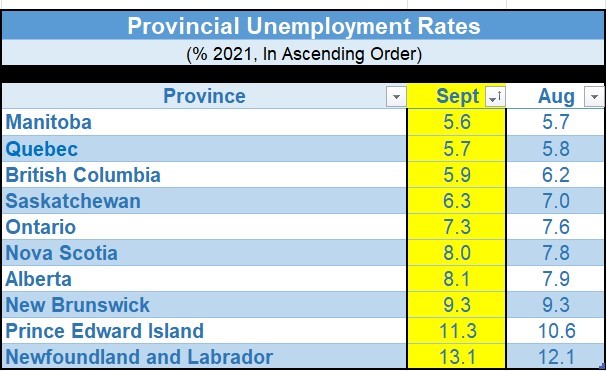
Employment increased in six provinces in September: Ontario, Quebec, Alberta, Manitoba, New Brunswick and Saskatchewan.

Service-sector increases (+142,000) were led by public administration (+37,000), information, culture and recreation (+33,000) and professional, scientific and technical services (+30,000).

Employment in accommodation and food services fell for the first time in five months (-27,000).

While employment in manufacturing (+22,000) and natural resources (+6,600) increased, there was little overall change in the goods-producing sector.

The gains in September brought employment back to the same level as in February 2020, just before the onset of the pandemic. However, the employment rate—that is, the proportion of the population aged 15 and older employed—was 60.9% in September, 0.9 percentage points lower than in February 2020, due to population growth of 1.4% over the past 19 months.

The number of employed people working less than half their usual hours was little changed in September and remained 218,000 higher (+26.8%) than in February 2020. Total hours worked were up 1.1% in September but were 1.5% below their pre-pandemic level.

Among 15-to-69-year-olds who worked at least half their usual hours, the proportion working from home was little changed in September at 23.8%. The ratio who worked from home was lowest in Saskatchewan (12.3%) and Newfoundland and Labrador (12.8%), and highest in Ontario (28.7%). Overall, at the national level, the proportion of workers who worked from home was higher in urban areas (25.2%) than in rural areas (15.9%).

In September 2021, 4.1 million Canadians who worked at least half their usual hours worked from home, similar to the level recorded in September 2020.


The unemployment rate declined for the fourth consecutive month in September, falling 0.2 percentage points to 6.9%, the lowest rate since the onset of the pandemic. The unemployment rate peaked at 13.7% in May 2020 and has trended downward since, with some short-term increases during the late fall of 2020 and spring of 2021, coinciding with the tightening of public health restrictions. In the months leading up to the pandemic, the unemployment rate had hovered around historic lows and was 5.7% in February 2020.

The adjusted unemployment rate—which includes those who wanted a job but did not look for one—was 8.9% in September, down 0.2 percentage points from one month earlier.

Long-term unemployment—the number of people continuously unemployed for 27 weeks or more—was little changed in September. There were 389,000 long-term unemployed, more than double the number in February 2020.

The ability of the long-term unemployed to transition to employment may be influenced by several factors, including their level of education and current labour market conditions. For example, those with no post-secondary education face a labour market where employment in occupations not requiring post-secondary education was 287,000 lower in September 2021 than in September 2019 (not seasonally adjusted).


Bottom Line 

The Bank of Canada has repeatedly suggested that it would not begin to tighten monetary policy until the economy returned to full capacity utilization, which they estimate will not be until at least the second half of next year. Employment will need to surpass pre-pandemic levels before complete recovery is declared because the population had grown since the start of the crisis 19 months ago.

Substantial job losses remain in the hardest-hit sectors. The chart below shows the employment change in percentage terms by sector compared with February 2020.

Sectors where remote work has been widespread–such as professional, scientific and technical services, public administration, finance, insurance and real estate–have seen a net gain in employment. However, in high-touch sectors that were deemed nonessential, the jobs recovery has been far more constrained. This is especially true in agriculture, accommodation and food services, and recreation. Ironically, these sectors have high job vacancy rates as many formerly employed here are reluctant to return. Enhanced benefits and compensation in these sectors will help.

Just this week, the BoC Governor Tiff Macklem reiterated that widespread inflation pressures are likely to remain at least until the end of this year. Most are reflective of global supply chain disruptions as well as extreme weather events. Just how long these will last is uncertain, but tighter monetary policy would have little impact on this type of inflation.

Nevertheless, bond markets have sold off worldwide in response to inflation fears and the annual US debt-ceiling antics. The final chart below shows the steepening of the Canadian yield curve since one year ago. The 5-year bond yield has risen sharply over that period, from 0.378% to a current level today of 1.205%. It is no surprise that 5-year fixed mortgage rates are rising.