DLC UPDATE: CANADIAN HOME SALES AND PRICES SET RECORDS AGAIN IN SEPTEMBER

Latest News Mark Goode 19 Oct

Canadian Home Sales and Prices Set Another Record High in September

Today’s release of September housing data by the Canadian Real Estate Association (CREA) shows national home sales rose 0.9% on a month-over-month (m-o-m) (see chart below). This continues the rebound in housing that began five months ago amid record-tight market conditions.

“Along with historic supply shortages in a number of regions, fierce competition among buyers has been putting upward pressure on home prices. Much of that was pent-up demand from the spring that came forward as our economies opened back up over the summer,” said Costa Poulopoulos, Chair of CREA.

According to Shaun Cathcart, CREA’s Senior Economist, “Reasons have been cited for this – pent-up demand from the lockdowns, Government support to date, ultra-low interest rates, and the composition of job losses to name a few. I would also remind everyone that sales were almost setting records and markets were almost this tight back in February so we were already close to where things are now, as far away from Goldilocks territory as we had ever been before. But I think another wildcard factor to consider, which has no historical precedent, is the value of one’s home during this time. Home has been our workplace, our kids’ schools, the gym, the park and more. Personal space is more important than ever.”

The modest uptick in home sales nationally reflected diverse results regionally with about 60% of local markets seeing gains. Increases in Ottawa, Greater Vancouver, Vancouver Island, Calgary and Hamilton-Burlington sales were mostly offset by declines in the Greater Toronto Area (GTA) and Montreal; although, activity in the two largest Canadian markets is still historically very strong.

Actual (not seasonally adjusted) sales activity posted a 45.6% y-o-y gain in September. It was a new record for the month of September by a margin of  20,000 transactions, the equivalent of a normal month of September with an entire month of December tacked on. Sales activity was up in almost all Canadian housing markets on a year-over-year basis.

New Listings

The number of newly listed homes declined by 10.2% in September, reversing the surge to record levels seen August. New supply was down in two-thirds of local markets, led by declines in and around Vancouver and the GTA.

With sales edging up in September and new supply dropping back, the national sales-to-new listings ratio tightened to 77.2% – the highest in almost 20 years and the third-highest monthly level on record for the measure.

Based on a comparison of sales-to-new listings ratio with long-term averages, about a third of all local markets were in balanced market territory, measured as being within one standard deviation of their long-term average. The other two-thirds of markets were above long-term norms, in many cases well above.
There were just 2.6 months of inventory on a national basis at the end of September 2020 – the lowest reading on record for this measure. At the local market level, a number of Ontario markets are now into weeks of inventory rather than months. Much of the province of Ontario is close to or under one month of inventory.

Home Prices

The Aggregate Composite MLS® Home Price Index (MLS® HPI) rose by 1.3% m-o-m in September 2020. Of the 39 markets now tracked by the index, all but two were up between August and September.

As buyers are moving further away from city centres, CREA added a large number of Ontario markets to the MLS® HPI this month. The list includes Bancroft and Area, Brantford Region, Cambridge, Grey Bruce Owen Sound, Huron Perth, Kawartha Lakes, Kitchener-Waterloo, the Lakelands (Muskoka-Haliburton-Orillia-Parry Sound), London & St. Thomas, Mississauga, North Bay, Northumberland Hills, Peterborough and the Kawarthas, Quinte & District, Simcoe & District, Southern Georgian Bay, Tillsonburg District and Woodstock-Ingersoll.

The non-seasonally adjusted Aggregate Composite MLS® HPI was up 10.3% on a y-o-y basis in September – the biggest gain since August 2017. The largest y-o-y gains in the 22-23% range were recorded in Bancroft and Area, Quinte & District, Ottawa and Woodstock-Ingersoll.

This was followed by y-o-y price gains in the range of 15-20% in Barrie, Hamilton, Niagara, Guelph, Brantford, Cambridge, Grey Bruce-Owen Sound, Huron Perth, the Lakelands, London & St. Thomas, North Bay, Simcoe & District, Southern Georgian Bay, Tillsonburg District and Montreal.

Prices were up in the 10-15% range compared to last September in the GTA, Oakville-Milton, Kawartha Lakes, Kitchener-Waterloo, Mississauga, Northumberland Hills, Peterborough and the Kawarthas, and Greater Moncton.

Meanwhile, y-o-y price gains were around 5% in Greater Vancouver, the Fraser Valley, the Okanagan Valley, Regina, Saskatoon and Quebec City. Gains were about half that in Victoria and elsewhere on Vancouver Island, as well and in St. John’s, and prices were more or less flat y-o-y in Calgary and Edmonton.

The actual (not seasonally adjusted) national average home price set another record in September 2020, topping the $600,000 mark for the first time ever at more than $604,000. This was up 17.5% from the same month last year.

 Bottom Line

Housing strength is largely attributable to record-low mortgage rates and pent-up demand by households that have maintained their level of income during the pandemic. The hardest-hit households are low-wage earners in the accommodation, food services, and travel sectors. These are the folks that can least afford it and typically are not homeowners.

The good news is that the housing market is contributing to the recovery in economic activity.  

Dr. Sherry Cooper

DR. SHERRY COOPER

Chief Economist, Dominion Lending Centres
Sherry is an award-winning authority on finance and economics with over 30 years of bringing economic insights and clarity to Canadians.

More Posts – Website

Follow Me:
TwitterFacebook

DLC UPDATE: STRONGER-THAN-EXPECTED CANADIAN JOBS REPORT IN SEPTEMBER

Latest News Mark Goode 14 Oct

Canada Has Recouped Three-Quarters Of Pandemic Job Losses

The September Labour Force Survey, released this morning by Statistics Canada, reflects labour market conditions during the week of September 13 to 19, six months after the onset of the COVID-19 economic shutdown. As Canadian families adapted to new back-to-school routines at the beginning of September, public health restrictions had been substantially eased across the country, and many businesses and workplaces had re-opened. Throughout the month, some restrictions were re-imposed in response to increases in the number of COVID-19 cases. In British Columbia, new rules and guidelines related to bars and restaurants were implemented on September 8. In Ontario, limits on social gatherings were tightened for the hot spots of Toronto, Peel and Ottawa on September 17 and the rest of the province on September 19.

Employment gains unexpectedly accelerated in September, increasing by 378,200, more than double the consensus forecast on a broadly based pickup in hiring. This was the fifth consecutive month of job gains, which has now retraced three-quarters of the 3 million jobs lost during March and April. The unemployment rate fell from 10.2% in August to 9.0% in September. Most economists had expected a job gain of 150,000 and a jobless rate of 9.8%.

Another piece of good news is that most of the net new jobs were in full-time work. The number of Canadians who were employed but worked less than half their usual hours for reasons likely related to COVID-19 fell by 108,000 (-7.1%) in September.

September gains brought employment to within 720,000 (-3.7%) of its pre-COVID February level. The accommodation and food services (-188,000) and retail trade (-146,000) industries remained furthest from full recovery, while youth employment was 263,000 (-10.3%) below February levels.

Among Canadians who worked most of their usual hours, the proportion working from home edged down from August to September, from 26.4% to 25.6%.

Employment increased in every province except New Brunswick and Prince Edward Island in September, with the largest gains in Ontario and Quebec.

As a result of the COVID-19 economic shutdown, the unemployment rate more than doubled from 5.6% in February to a record high of 13.7% in May. The 9.0% jobless rate in September marks a rapid improvement.  By comparison, during the 2008/2009 recession, the unemployment rate rose from 6.2% in October 2008 to peak at 8.7% in June 2009. It then took approximately nine years to return to its pre-recession rate.

Employment in accommodation and food services rose by 72,000 (+7.4%) in September. This was the fifth consecutive monthly increase and brought total gains since the initial easing of COVID-19 restrictions in May to 427,000. Nevertheless, this industry’s employment was the furthest from recovery in September, down 15.3% (-188,000) from its pre-pandemic February level.

The accommodation and food services industry is likely to continue to face many challenges over the coming months. While outdoor dining is likely to become impractical during the winter months and as some COVID restrictions are re-introduced, a recent study indicated that Canadians plan to reduce spending at restaurants.

Following four months of increases, employment in retail trade held steady in September. Compared with February, employment in this industry was down by 146,000 (-6.4%). After increasing sharply in May and June, following the initial easing of COVID-19 restrictions, retail sales slowed markedly in July.

IN CONSTRUCTION, A LONG ROAD TO RECOVERY REMAINS.

Employment in construction remained little changed for the second consecutive month in September and was down by 120,000 (-8.1%) compared with its pre-COVID level. Compared with February, employment in construction was down the most in Ontario (-54,000; -9.5%) and British Columbia (-39,000; -16.3%).

Construction consists of three subsectors: construction of buildings, heavy and civil engineering construction, and specialty trade contractors. According to the latest results from the Survey of Employment Payrolls and Hours, employment in construction fell from February to July in each of these subsectors, with the largest decline among specialty trade contractors. The release of investment in building construction for July showed that investment in building construction was slightly lower in July than in February.

MANUFACTURING EMPLOYMENT ALMOST FULLY RECOVERED, BUT LAGGING IN ALBERTA.

While some industries face a long recovery to pre-COVID employment levels, some sectors—including manufacturing—have almost fully recovered.

The pace of employment growth in manufacturing picked up in September (+68,000; +4.1%), following two months of modest growth over the summer. The September gains brought the total employment change in this industry to a level similar to that of February. While employment in manufacturing remained well below pre-pandemic levels in Alberta (-17,000; -12.1%) and to a lesser extent in Quebec (-15,000; -3.1%), employment was above the pre-COVID level in Ontario (+17,000; +2.3%).

EMPLOYMENT IN EDUCATIONAL SERVICES RISES IN SEPTEMBER AND SURPASSES PRE-COVID LEVELS.

Employment in educational services grew by 68,000 (+5.0%) in September, led by Ontario and Quebec. After declining by 11.5% from February to April, employment in the industry has increased for five consecutive months and has reached a level 2.6% higher than in February.

As students returned to school in August and September, some jurisdictions increased staffing levels to support classroom adaptations. On a year-over-year basis, employment in educational services was up by 32,000 (+2.3%) in September, driven by an increase in elementary and secondary school teachers and educational counsellors (not seasonally adjusted).

Bottom Line 
The labour market impact of the COVID-19 economic shutdown has been particularly severe for low-wage employees (defined as those who earned less than $16.03 per hour, or two-thirds of the 2019 annual median wage of $24.04/hour). From February to April, employment among low-wage employees fell by 38.1%, compared with a decline of 12.7% for all other paid employees (not seasonally adjusted).

Almost half of the year-over-year decline in low-wage employees in September was accounted for by three industries: retail trade; accommodation and food services; and business, building and other support services industries.

The pandemic has disproportionately hit low-wage workers and youth, explaining why housing activity has been so strong. Low-wage employees and youth are typically not homebuyers or sellers.

Moreover, the RBC COVID Consumer Spending Tracker for the week of October 5 shows that spending trends continued solid with few signs of second-wave worries impacting consumer confidence yet.

According to RBC:

  • “Among retail categories, clothing spending continued to climb, returning to year-ago levels.
  • Spending on apparel, gifts, and jewelry was up 1.5% relative to last year.
  • Other retail categories held on to gains from the past few months.
  • Despite plateauing in dollar terms, entertainment spending ticked up relative to last year.
  • During the summer, high golf spending likely continued into early fall— rather than slowing down as it would have in a normal year.
  • Slower spending on accommodation and car rentals accelerated a downward trend in travel-related purchases that have dominated in the last several weeks.
  • Travel spending had recovered partially from pandemic lows; it was still down about 60% in peak summer. It worsened again as the weather cooled.
  • Simultaneously, automotive spending fell slightly, in line with seasonal trends, as the summer road trip season came to an end.
  • Labour Day saw the strongest restaurant spending since before the pandemic, but the uptick was fleeting.
  • Spending on dining out quickly fell back to -6% relative to a year ago, a level it’s hovered around since July.”

Recently released data from the real estate boards in Toronto and Vancouver showed strong sales activity and significant further upward pressure on prices. In the GTA, a surge in new listings of high-rise condos meant that the upward pressure on home prices was driven by the ground-oriented market segments, including detached and semi-detached houses and townhouses. Home sales and new listing activity reached record levels in Metro Vancouver last month. The heightened demand from home buyers is keeping overall supply levels down. This is creating upward pressure on home prices, which have been edging up since the spring.

The CREA data for the whole country will be out on the 15th of October. This adjusts the price data for types of homes sold, giving us a better idea of how significant price pressures have been and in which sectors—more on that next week. 

Dr. Sherry Cooper

DR. SHERRY COOPER

Chief Economist, Dominion Lending Centres
Sherry is an award-winning authority on finance and economics with over 30 years of bringing economic insights and clarity to Canadians.

More Posts – Website

Follow Me:
TwitterFacebook

BoC UPDATE: BANK OF CANADA HOLDS RATE AT 25 BPS

Latest News Mark Goode 9 Sep

BANK OF CANADA RELIES ON QUANTITATIVE EASING

As promised, the Bank held its target overnight rate at the effective lower bound of 25 basis points with the clear notion that negative policy rates are not in the cards. Instead, the central bank will rely on large-scale asset purchases–quantitative easing (QE–of at least $5 billion per week of Government of Canada bonds. QE adds liquidity to the financial system and keeps market yields low. The Bank began aggressive QE with the beginning of the pandemic and will not cease until the economy has recovered, and inflation is sustainably at 2%. This could be years away, as for example, Ontario has paused reopening plans with the virus numbers ticking up. Many public health officials are expecting infections to rise with the opening of schools and the turn to colder weather. The government is preparing for a possible second wave. Policymakers, however, have dialed back language on more aggressive action.

The Bank has stated, “Both the global and Canadian economies are evolving broadly in line with the scenario in the July Monetary Policy Report (MPR), with activity bouncing back as countries lift containment measures. The Bank continues to expect this strong reopening phase to be followed by a protracted and uneven recuperation phase, which will be heavily reliant on policy support. The pace of the recovery remains highly dependent on the path of the COVID-19 pandemic and the evolution of social distancing measures required to contain its spread.”

In Canada, real GDP fell by 11.5% (39% annualized) in the second quarter, resulting in a decline of just over 13% in the first half of the year, mainly in line with the Bank’s July Monetary Policy Report (MPR) central scenario. All components of aggregate demand weakened, as expected. Global financial conditions have remained accommodative. Although prices for some commodities have firmed, oil prices remain weak.

As the economy reopens, the bounce-back in activity in the third quarter looks to be faster than anticipated in July. Economic activity has been supported by government programs to replace incomes and subsidize wages. Core funding markets are functioning well, and this has led to a decline in the use of the Bank’s short-term liquidity programs. Monetary policy is working to support household spending and business investment by making borrowing more affordable.

Housing activity has been particularly robust with substantial existing home sales in July and August. With record-low mortgage rates, buyers are satisfying their demand for more space and for moving further from city-center congestion. This urban exodus is more than anecdotal. You can get more for your money, and with many people working from home, long commutes don’t seem to be as relevant. The chart below shows that the outer suburbs of Toronto have seen the most significant increase in sales since the market picked up in early June.

Also, the construction of new homes surged to the highest level in more than a decade in August following a sharp increase in July. The greatest strength was in Toronto and Vancouver, particularly in multiple units.

Household spending rebounded sharply over the summer, with stronger-than-expected goods consumption and housing activity. There has also been a large but uneven rebound in employment. Exports are recovering in response to strengthening foreign demand, but are still well below pre-pandemic levels. Business confidence and investment remain subdued. While recent data during the reopening phase is encouraging, the Bank continues to expect the recuperation phase to be slow and choppy as the economy copes with ongoing uncertainty and structural challenges.

CPI inflation is close to zero, with downward pressure from energy prices and travel services, and is expected to remain well below target in the near term. Measures of core inflation are between 1.3% and 1.9%, reflecting the large degree of economic slack, with the core measure most influenced by services prices showing the weakest growth.

Bottom Line

The Bank also suggested that “as the economy moves from reopening to recuperation, it will continue to require extraordinary monetary policy support. The Governing Council will hold the policy interest rate at the effective lower bound until economic slack is absorbed so that the 2% inflation target is sustainably achieved. To reinforce this commitment and keep interest rates low across the yield curve, the Bank is continuing its large-scale asset purchase program at the current pace. This QE program will continue until the recovery is well underway and will be calibrated to provide the monetary policy stimulus needed to support the recovery and achieve the inflation objective.”

The next policy meeting will be held on October 28 when the Bank will release its new forecast in the MPR. A rate hike is unlikely this year or in 2021.

Dr. Sherry Cooper

DR. SHERRY COOPER

Chief Economist, Dominion Lending Centres
Sherry is an award-winning authority on finance and economics with over 30 years of bringing economic insights and clarity to Canadians.

More Posts – Website

Follow Me:
TwitterFacebook

DLC UPDATE: Strong August Jobs Report in Canada

Latest News Mark Goode 4 Sep

Canada Has Recouped Two-Thirds Of Pandemic Job Losses

The August Labour Force Survey, released this morning by Statistics Canada, reflects labour market conditions as of the week of August 9 to 15, five months after the onset of the COVID-19 economic shutdown. By mid-August, public health restrictions had substantially eased across the country and more businesses and workplaces had re-opened.

Employment rebounded in August by 246,000 net new jobs, a slowdown from the 419,000 gain in July and June’s 953,000 rise. This slowdown was expected with the initial recovery boost from easing containment measures in the spring fading through the summer.

The great news is that 84% of the headline jobs gain in August was in full-time positions. This follows the surge in part-time jobs in July. Full-time employment stood at 93.9% of pre-pandemic levels in August, compared with 96.1% for part-time work. In the months prior to the COVID-19 economic shutdown, full-time employment had reached record highs, while growth in part-time work was relatively flat. Compared with 12 months earlier, full-time employment was down 5.4% in August, while part-time work decreased by 5.1%. And an elevated share of those working part-time is doing so despite preferring full-time work. Hours worked increased more than employment in August–but are still down more relative to pre-shock February levels (-8.6%) than the headline employment count (-5.7%).

The August job growth brought employment to within 1.1 million of its pre-COVID February level, thereby recouping two-thirds of all the lost jobs.

The number of Canadians who were employed but worked less than half their usual hours for reasons likely related to COVID-19 fell by 259,000 (-14.6%) in August. Combined with declines in May, June and July, this left COVID-related absences from work at 713,000 (+88.3%) above February levels.

As of the week of August 9 to 15, the total number of Canadian workers affected by the COVID-19 economic shutdown stood at 1.8 million. In April, this number reached a peak of 5.5 million, including a 3.0 million drop in employment and a 2.5 million increase in COVID-related absences from work.

The number of Canadians working from home declined for the fourth consecutive month. In April, at the height of the COVID-19 economic shutdown, 3.4 million Canadians who worked their usual hours had adjusted to public health restrictions by beginning to work from home. This number has fallen each month since May when the gradual easing of public health restrictions began and reached 2.5 million in August.

Among Canadians who worked their usual hours in August, the total number working from home fell by nearly 300,000 compared with July, while the number working at locations other than home increased by almost 400,000.

THE JOBLESS RATE CONTINUED TO FALL IN AUGUST

The unemployment rate fell 0.7 percentage points to 10.2% in August. As a result of the COVID-19 economic shutdown, the unemployment rate had surged from 5.6% in February to a record high of 13.7% in May. By way of comparison, during the 2008/2009 recession, the unemployment rate rose from 6.2% in October 2008 and reached a peak of 8.7% in June 2009. It took approximately nine years before it returned to its pre-recession rate.

The unemployment rate fell most sharply in August among core-aged women aged 25 to 54 years old, down 1.2 percentage points to 7.5%, the lowest unemployment rate among all major groups. This decline was largely due to employment increases, as overall labour force participation was unchanged from July. The unemployment rate for core-aged men fell 0.7 percentage points to 8.1%, also the result of increased employment, with little change in their labour market participation.

Employment gains in the services sector continued to outpace that of the goods-producing sector. Employment growth in the services sector was driven by gains in educational services, accommodation and food services and the “other services” industry. In the goods sector, gains in manufacturing were partially offset by declines in natural resources.

Accommodation and food services as well as retail trade were among the industries hardest hit by the initial COVID-19 economic shutdown. By April, employment had fallen to half (-50.0%) of its pre-pandemic level in accommodation and food services and to 77.1% of its pre-COVID-19 level in retail trade. Starting in May, employment rebounded in both sectors as many provinces began reopening their economy.

Employment growth in accommodation and food services rose by 18.4% per month on average from May to July. In August, however, the pace of growth in the industry slowed to 5.3% (+49,000). Despite these recent gains, employment in accommodation and food services was at 78.9% of its February level. August marked the fifth full month of international travel restrictions, which continues to affect industries with strong ties to tourism.

The number of people employed in retail trade edged up 0.7% (+14,000) in August, following average monthly increases of 6.3% over the previous three months. Employment in retail trade reached 93.4% of its pre-COVID-19 level but fell just below the rate of recovery for total employment (94.3%).

While employment remained below pre-COVID-19 levels, retail sales in June were higher than in February and are expected to continue to rise in July, based on preliminary estimates. This highlights potential structural changes within the industry as employers have been able to increase their sales despite a smaller workforce.

Employment Increased in Most Provinces in August–Led by Ontario and Quebec

Employment in Ontario rose by 142,000 in August (+2.0%), nearly all in full-time work, while the unemployment rate fell by 0.7 percentage points to 10.6%. Combined with the employment increases in June and July (+529,000), the gains in August brought employment in Ontario to within 93.6% of its pre-pandemic level.

In the census metro area (CMA) of Toronto, employment increased by 121,000 (+3.8%), nearly double the growth rate of the province, and reached 93.3% of its pre-pandemic level.

In Quebec, employment increased by 54,000 (+1.3%) in August, building on gains of 576,000 over the previous three months, and bringing employment in the province to within 95.7% of its pre-COVID level.

In the Montréal CMA, employment grew by 38,000 (+1.8%) in August and reached 96.0% of its pre-pandemic level.

Employment rose in most Western provinces in August. British Columbia reported the largest increase, up 15,000 (+0.6%). Employment reached 94.1% of its February level and the unemployment rate fell 0.4 percentage points to 10.7%.

While employment in Alberta was little changed, the unemployment rate declined by a full percentage point to 11.8% as fewer people looked for work.

In Atlantic Canada, Nova Scotia had the largest employment gain in August, up 7,200 (+1.6%), mostly in part-time work. The unemployment rate was little changed at 10.3%, as more Nova Scotians participated in the labour market. After notable increases in May and June, employment in New Brunswick held steady for the second consecutive month.

Bottom Line 

This was still a relatively strong employment report even though job gains have slowed. Canada’s employment recovery has outpaced the US, recouping two-thirds of the lost jobs compared to only a 50% gain south of the border. The hardest-hit has been both low-wage workers and youth, which helps to explain why housing activity has been so strong. Low-wage employees and youth are typically not homebuyers or sellers. Moreover, consumer spending in Canada has solidified very near to pre-COVID levels. Spending on entertainment, dining and self-care has risen recently as more businesses open up and is now approaching year-ago levels. Total credit or debit card spending is up about 5% relative to the same time last year. Canadians are venturing out more around their home towns, but not going much further.

According to RBC:

  • “While online spending remained prevalent in some areas (e.g., groceries), in-person transactions continued to recover.
  • Spending indicates Canadians were comfortable going out to dinner, even if to a patio. Restaurant spending was buoyed by Canadians seeking in-person dining experiences and was down just over 4% from last year’s level.
  • The share of online transactions at restaurants decreased to 17% from one-third at its post-crisis peak.
  • Health and self-care spending increased through mid-August, as gym reopening’s led to an uptick in fitness spending.
  • Entertainment spending picked up further into August and was down 10% relative to last year.
  • Spending was supported by still-strong spending on golf and to a lesser degree digital goods.
  • More recently, Canadians began spending again on professional sports, lotteries, hobbies, and local attractions.”

Recent data from the local real estate boards in Toronto and Vancouver showed strong sales activity and significant further upward pressure on prices. The CREA data for the whole country will be out on the 15th of September. This adjusts the price data for types of homes sold, giving us a better idea of how significant price pressures have been. 

Dr. Sherry Cooper

DR. SHERRY COOPER

Chief Economist, Dominion Lending Centres
Sherry is an award-winning authority on finance and economics with over 30 years of bringing economic insights and clarity to Canadians.

More Posts – Website

Follow Me:
TwitterFacebook

DLC UPDATE: Canadian Q2 GDP Growth Plunge–Rebounds Since April

Latest News Mark Goode 28 Aug

Canadian Economy Took a Record Nosedive in Q2

Canadian real GDP plunged 11.5% in the second quarter, or -38.7% at an annualized rate, the worst quarterly decline on record (see chart below). This followed an 8.2% plunge in Q1. The worst of the contraction occurred early in the quarter as the lockdown in March and April wreaked havoc on activity. Since then, the economy has shown surprisingly strong signs of recovery.

StatsCan revealed today that GDP rose 6.5% in June following the 4.8% rise in May and an estimated 3.0% growth in July. Even so, Canada’s recovery is expected to be bumpy and long. No doubt, not all businesses and sectors will expand in sync, and not all jobs will be recovered.

One of the brightest spots in the recovery has been housing, where activity surged in July, reflective of record-low mortgage rates and pent-up demand. Apparently, many homebound Canadians are reassessing their housing needs. Demand for increased space, especially in the suburbs or exurbs, has been robust.

Virtually every sector of the economy was battered in Q2. Household spending dived 43% while business investment collapsed at a 57% annual rate. Virus containment weighed on both, with a fall in oil prices exacerbating the decline in oil & gas investment. Net exports were the only sector that added to economic activity, but only because imports fell more than exports as housebound consumers and shuttered businesses had little need for imported products.

On a year-over-year basis, the monthly rise in June and July will leave GDP down a much milder 5%, but still worse than the -4.7% drop during the financial crisis. The surge in June–itself a record bounce–reflects the gradual re-opening of the economy, with retail, wholesale and manufacturing leading the way. Retail trade jumped 22.3% in June, surpassing its pre-pandemic level of activity. Motor vehicle dealers contributed most to growth.

Following a 17.3% jump in May, the construction sector rose 9.4% in June as a continued easing of emergency restrictions across the country contributed to the return to nearly normal levels of activity at construction sites. Residential construction grew 7.1% as increases in multi-unit dwellings construction and home alterations and improvements more than offset lower single-unit construction. Non-residential construction rose 11.0%, surpassing the pre-pandemic level of activity, as all three components were up.

Real estate and rental and leasing grew 2.5% in June. Activity at the offices of real estate agents and brokers jumped 65.2% in the month, following a 56.4% increase in May, as home resale activity in all major urban centres saw double-digit increases. The output of real estate agents and brokers was about 7% below February’s pre-pandemic level, but other data show it was up sharply in July, hitting new record highs.

GOVERNMENT PROVIDED A MUCH-NEEDED CUSHION 

Household disposable income surged last quarter despite the pandemic thanks to government income support (see chart below). The rise in income, coupled with the massive decline in consumer spending as well as the deferral of mortgage payments for many triggered a surge in the savings rate. The household saving rate jumped to 28.2% from 7.6% in the prior quarter. Savings rates, of course, are generally higher for higher income brackets.

BOTTOM LINE

The plunge in economic activity in the second quarter–though awful–was not as deep as the Bank of Canada expected (-43%) in its most recent Monetary Policy Report. As well, the rebound since the end of April has been stronger than expected, especially in the housing sector. To be sure, labour market conditions are still very soft with the jobless rate at 10.9% in July, but the new programs announced last week by the federal government to replace CERB will help ease the transition for people still looking for work.

A possible resurgence in the virus remains a risk unless an effective vaccine can be distributed. The economy will operate below capacity into the next year, but perhaps not as drastically below capacity as previously feared.

Dr. Sherry Cooper

DR. SHERRY COOPER

Chief Economist, Dominion Lending Centres
Sherry is an award-winning authority on finance and economics with over 30 years of bringing economic insights and clarity to Canadians.

More Posts – Website

Follow Me:
TwitterFacebook

DLC UPDATE: GREAT NEWS ON THE JOB FRONT IN JULY

Latest News Mark Goode 7 Aug

Better-Than-Expected Canadian Jobs Report in July Shows Economy’s Resilience

The July Labour Force Survey, released this morning by Statistics Canada, reflects labour market conditions as of the week of July 12 to 18. Although public health restrictions had been substantially eased in most parts of the country—with the exception of some regions of Ontario, including Toronto—some measures remained in place, including physical distancing requirements and restrictions on large gatherings.

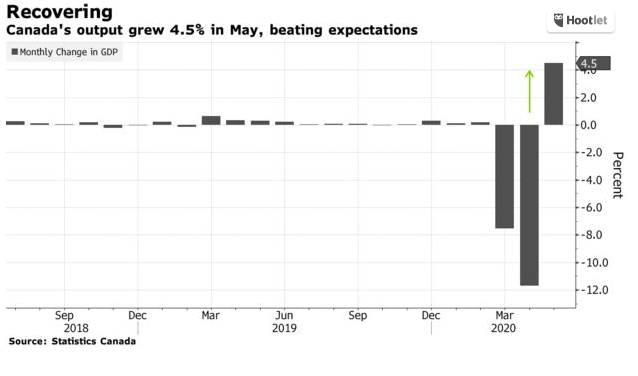
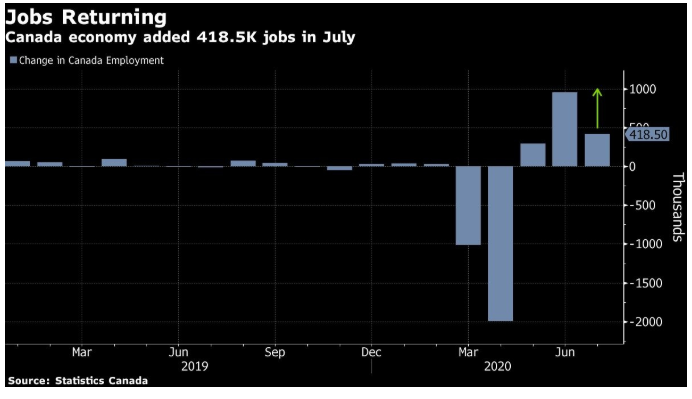
From February to April, 5.5 million Canadian workers–30% of the workforce–were affected by the COVID-19 economic shutdown. This included a drop in employment of 3.0 million and a COVID-related increase in absences from work of 2.5 million. Today’s jobs report showed that total employment rose by 418,500 (+2.4%). This is on the heels of a 953,000 (5.8%) gain in June and 290,000 in May. Altogether, this brought employment to within 1.3 million (-7.0%) of its pre-COVID February level.

The number of Canadians who were employed but worked less than half their usual hours for reasons likely virus-related dropped by 412,000 (-18.8%) in July. Combined with declines recorded in May and June, this left COVID-related absences from work at just under 1 million (+972,000; +120.3%) above February levels.

By the week of July 12 to July 18, the total number of affected workers stood at 2.3 million, a reduction since April of 58.0%.

MOST EMPLOYMENT GAINS IN JULY WERE IN PART-TIME WORK

Most of the employment gains in July were in part-time work, which increased by 345,000 (+11.3%), compared with a much smaller increase of 73,000 (+0.5%) in full-time work.

The COVID-19 labour market shock was felt particularly hard in part-time work. From February to April, losses in part-time work (-29.6%) were significantly heavier than in full-time employment (-12.5%). This was due to a number of factors, including part-time work being more prevalent in industries that were most affected by the COVID-19 economic shutdown, namely retail trade and accommodation and food services.

Growth in part-time employment has outpaced full-time growth in each of the past three months. With July gains, part-time work is now closer to its pre-COVID level (-5.0%) than full-time employment (-7.5%).

The relatively flat growth in full-time work in recent months is reflected in an increase in the proportion of part-time workers doing so involuntarily. In July 2019, 22.2% of those working less than 30 hours per week would have preferred full-time work. One year later, this proportion had increased 7.6 percentage points to 29.7%, an indication that the COVID-19 economic shutdown and subsequent re-opening has resulted in a reduction, at least temporarily, in the number of hours being offered by employers.

STRONGER EMPLOYMENT GAINS FOR WOMEN IN JULY, BUT MEN CONTINUE TO BE CLOSER TO PRE-SHUTDOWN LEVELS

In July, employment rose faster among women (+3.4% or +275,000) than men (+1.5% or +144,000). Due to heavier employment losses among women in March, however, employment in July was closer to its pre-shutdown level for men than for women.

Employment was little changed in July among both male and female core-aged workers with children under 18.  As in June, employment in July was furthest away from pre-shutdown levels among mothers whose youngest child was aged 6 to 17.

THE NUMBER OF CANADIANS WORKING FROM HOME CONTINUED TO FALL IN JULY

Among those who were employed and not absent from work, the number working from home dropped by 400,000, compared with an increase of 300,000 in the number working at locations other than home. Despite this decline, the number of Canadians who worked from home in July (4.6 million) remained significantly higher than the number who usually do so (1.6 million).

THE PACE OF IMPROVEMENT FROM JULY ON IS LIKELY TO CONTINUE TO SLOW. 

Compared to February, there were still 274,000 fewer people working in goods production jobs in July. There were still 309,000 fewer workers in accommodation and food services, 109,000 fewer in information, culture, and recreation, over that period – and those services jobs will probably be slower to return with households still sticking closer to home. The recovery in the goods-producing side of the economy will be limited at some point by ongoing weakness in the oil & gas sector.

UNEMPLOYMENT RATE CONTINUES TO DROP FROM MAY’S RECORD HIGH

The unemployment rate was 10.9% in July, falling 1.4 percentage points for the second consecutive month and down from a record high of 13.7% in May. The unemployment rate was 5.6% in February.

The number of unemployed people fell for the second consecutive month in July, down 269,000 (-11.0%). Despite this decrease, almost 2.2 million Canadians were unemployed in July, nearly twice as many (+92.6%) as in February (1.1 million).

In July, temporary layoffs declined sharply for a second consecutive month, down 384,000 (-45.5%). Among those on temporary layoff in June, approximately half became employed in July, either returning to their old job or starting a new one (not seasonally adjusted). Despite the sharp declines in June and July, the number of people on temporary layoff (460,000) was more than four times higher than it was in February.

In July, the number of people searching for work increased 115,000 (+7.1%), mainly the result of people entering the labour force to look for work.

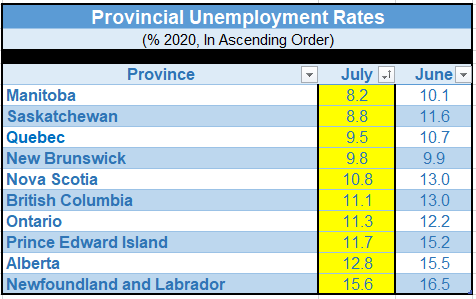
Employment Increases in Most Provinces in July–Led by Ontario and Quebec

In Ontario, employment rose by 151,000 (+2.2%) in July, building on an increase of 378,000 in June and bringing jobs to 91.7% of its pre-pandemic February level. The initial easing of COVID-19 restrictions occurred later in Ontario than in most other provinces. Additional easing was introduced in most regions of the province on July 17, at the end of the survey week.

Employment in the census metropolitan area of Toronto increased by 2.2% in July. This was the same rate of increase as the province, despite the loosening of the COVID-19 restrictions occurring later in the provincial capital than in most other regions. Employment in Toronto reached 89.9% of its February level.

Employment in Quebec increased by 98,000 (+2.4%) in July, adding to gains in the previous two months and bringing employment to 94.4% of its pre-COVID level. The increase in employment in July was all in part-time work. The unemployment rate decreased 1.2 percentage points to 9.5%, the third consecutive monthly decrease.

Employment rose more slowly in Montréal  (+28,000; +1.3%) than in the rest of Quebec and reached 94.4% of its February level.

The number of employed British Columbians increased by 70,000 (+3.0%) in July, reaching 93.5% of the February employment level. The unemployment rate fell by 1.9 percentage points to 11.1%.

In Vancouver, employment increased by 48,000 (+3.8%) to reach 89.9% of the February level, a degree of recovery lower than the province as a whole.

In Alberta, employment increased by 67,000 (+3.2%) in July, including gains in both full-time and part-time work. The unemployment rate for the province fell by 2.7 percentage points in July to 12.8%, the first decline since the COVID-19 economic shutdown.

In Saskatchewan, employment rose by 13,000 (+2.5%), while the unemployment rate fell 2.8 percentage points to 8.8%.

Employment in Manitoba increased (+12,000) for the third consecutive month, and the unemployment rate declined by 1.9 percentage points to 8.2%.

Employment in Newfoundland and Labrador increased by 4,300 (+2.1%) in July, and the unemployment rate dropped 0.9 percentage points to 15.6%.

In Nova Scotia, employment rose by 3,400 (+0.8%) in July, reaching 92.7% of its February level. The unemployment rate in the province declined by 2.2 percentage points to 10.8%.

Employment in Prince Edward Island rose by 1,100 in July (+1.5%), adding to the gains in the previous two months. The unemployment rate declined by 3.5 percentage points to 11.7%.

In New Brunswick, employment was little changed in July after recording employment gains of 39,000 from April to June. Employment in the province—which was among the first to begin easing COVID-19 restrictions—was at 96.6% of its pre-COVID February level, the most complete employment recovery of all provinces to date.

BOTTOM LINE 

This was a strong jobs report, but the low-hanging fruit has already been picked. Undoubtedly, Canada’s economy is still digging itself out of a deep hole, and some jobs are gone for good. Accommodation and food services are still hard hit, as is leisure and entertainment.

Many small and some large businesses will not survive. But new sectors are proliferating as the pandemic accelerated the technological forces that were already in train. I expect to see strong job growth in the following new and burgeoning areas: telemedicine, big data, artificial intelligence, cloud services, cybersecurity, 5G, driverless transportation and clean energy. Online shopping will also continue to proliferate as Canadians have learned to use delivery services and online retail.

Unfortunately, those who can afford it least were hardest hit in the pandemic-shutdown. Many of the lost jobs will not return.

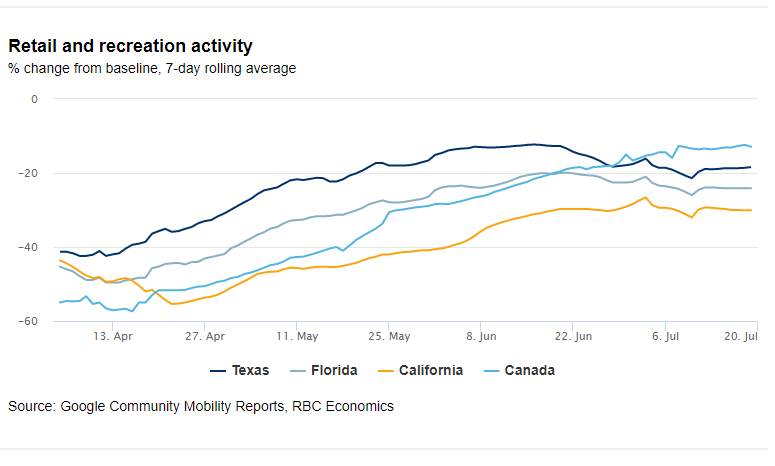
Canada has done an excellent job of flattening the pandemic curve, but as evidenced by what is happening in the US, we cannot let our guard down. As many students return to the classroom, the risk of disease spread will undoubtedly rise. Also, we have no idea what colder weather will bring or when a vaccine will be widely available. We must continue to prepare for the worst but hope for the best. In the meantime, our economy is proving its underlying resilience, and our government policies are cushioning the blow to those that are suffering the most.

South of the Border–US COVID Situation Is A Disaster 

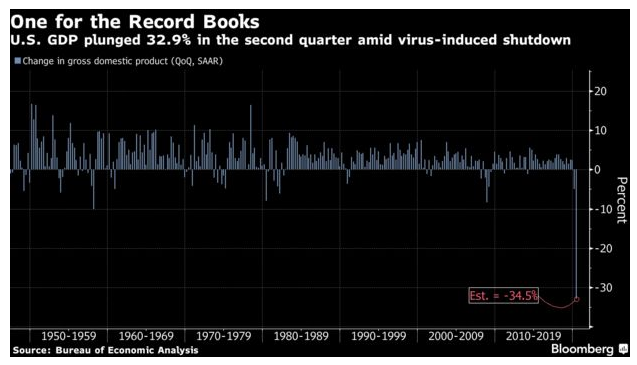
Nearly every country has struggled with the pandemic and made mistakes along the way. But the US stands alone among affluent countries in the failure of its pandemic response. In the past month, about 1.9 million Americans have tested positive for the virus. That’s more than five times as many as in all of Europe, Canada, Japan, South Korea and Australia, combined.

“Even though some of these countries saw worrying new outbreaks over the past month, including 50,000 new cases in Spain … the outbreaks still pale in comparison to those in the United States. Florida, with a population less than half of Spain, has reported nearly 300,000 cases in the same period,” wrote David Leonhardt of the New York Times yesterday.

Moreover, the end of July saw the expiration of the $600/week federal top-up of unemployment benefits, which to-date has been successful at providing a floor for household income, and subsequently helps boost household spending. As well, the prohibition of eviction has ended as Congress continues to wrangle on a new relief package.

Larry Kudlow, the administration’s chief economist, declared last week that a “V-shaped recovery” was still on track. There is no way that will be possible given the suspension or reduction in federal assistance, the rapidly depleting funds of the state and local governments who are, by law, not allowed to run budget deficits, and the continued surge in the disease.

Today’s July jobs report in the US showed the economic rebound was still making headway as payrolls increased by 1.76 million in July, beating economists estimates. The unemployment rate fell to 10.2%, while a broader gauge of joblessness also declined to 16.5%.

The path forward for the US will remain quite difficult as businesses use up the last of their federal loans and reduced unemployment benefits pressure consumer spending. The rebound in the US economy is fragile, as high-frequency data continue to indicate. For the week of July 31st, new COVID cases continue to worsen. Some states have had to halt or even backpedal reopening plans; same-store sales are falling, as are restaurant bookings, electricity demand, airline tickets and public transit ridership.

At the time of this writing, the latest headlines are screaming that “US Virus Aid Talks Are On the Brink of Collapse,” as Trump mulls over an executive order on some jobless aid. American consumer confidence can’t help but be badly battered by such incompetence, as the world looks on in utter disbelief.

Dr. Sherry Cooper

DR. SHERRY COOPER

Chief Economist, Dominion Lending Centres
Sherry is an award-winning authority on finance and economics with over 30 years of bringing economic insights and clarity to Canadians.

More Posts – Website

Follow Me:
TwitterFacebook

DLC UPDATE: CANADA’S ECONOMY IS OUTPERFORMING THE US

General Mark Goode 4 Aug

Canadian Economy Recovers Almost Half Its COVID-Induced Loss in May and June

The Canadian economy bounced back sharply in May and June as Canadian provinces eased lockdown measures.

GDP expanded 4.5% in May, and activity in June was even more robust at an estimated 5% rise. Cumulatively, GDP rose 10% in May and June, after plummeting more than 18% in March and April. These figures are calculated on a month-over-month basis.

These figures point to about a 40% annual rate decline in second-quarter GDP in Canada, which is roughly in line with economists’ projections. South of the border, the US posted a 33% contraction in GDP for the second quarter, the most massive plunge on record (see details below). It’s not surprising that Canada’s economy tanked by more than the US in Q2, as Canada enacted more aggressive restrictions earlier than the US and eased them more slowly. These public health restrictions were well worth it, as Canada has had far greater success at flattening the curve of new cases and deaths. Moreover, Canada’s economy will likely outpace the US in Q3, showing the benefit of allowing the public health considerations to dominate.

Canadian output was up in most sub-sectors in May, with double-digit monthly gains by retailers coinciding with the reopening of many stores. Construction, too, recorded a strong rebound, with activity up 17.6% month-over-month in the sector.

Activity at food services and bars rose 35.1% in May as dining rooms and patios began to open in certain parts of the country, while other restaurants continued relying exclusively on take-out and delivery. Meanwhile, accommodation services dropped 2.3%, as ongoing restrictions on international and interprovincial travel kept most Canadians at home.

Real estate and rental and leasing increased 1.5% in May following a 3.4% decline in April. Activity at the offices of real estate agents and brokers jumped 57.1% in the month, as home resale activity in nearly all major urban centres increased in conjunction with a substantial increase in the number of newly listed homes. Nevertheless, the output of real estate agents and brokers remained 44% below February’s level.

Arts, entertainment, and recreation declined another 2.9%. We expect some of these services industries to continue to lag the recovery as demand will be slow to rise due to remaining safety protocols and concerns about virus spread.

Oil production remained sluggish in May, down another 2.7% from April and drilling activity has yet to show signs of a significant rebound into the summer.

US ECONOMY SHRINKS AT A RECORD 32.9% PACE IN Q2

US gross domestic product shrank 9.5% in the second quarter from the first, a drop that equals an annualized pace of 32.9%, the Commerce Department’s initial estimate showed on Thursday. That’s the steepest annualized decline in quarterly records dating back to 1947. The drop in GDP in the quarter was close to expectations but was still alone more than twice the total 6-quarter peak-to-trough decline in the 2008/09 recession.

Consumer spending, which makes up about two-thirds of GDP, slumped an annualized 34.6%, also the most on record. While employment, spending and production have improved since reopenings picked up in May and massive federal stimulus reached Americans, a recent surge in infections has tempered the pace of the recovery.

US Jobless Claims

A separate report Thursday showed the number of Americans filing for unemployment benefits increased for a second straight week. Initial claims through regular state programs rose to 1.43 million in the week ended July 25, up 12,000 from the prior week, the Labor Department said. There were 17 million Americans filing for ongoing benefits through those programs in the period ended July 18, up 867,000 from the prior week.

While the economic restart has helped put 7.5 million Americans back to work in May and June combined, payrolls are down more than 14.5 million from their pre-pandemic peak.

“We have seen some signs in recent weeks that the increase in virus cases, and the renewed measures to control it, are starting to weigh on economic activity,” Fed Chairman Jerome Powell said at a news conference Wednesday after the central bank’s two-day policy meeting. “On balance, it looks like the data are pointing to a slowing in the pace of the recovery,” though it was too soon to say how extensive — or sustained — this period would be, he said. This is a reminder that there are limits to how much the economy can rebound to a ‘new normal’ in the absence of a vaccine or more effective treatments.

According to Bloomberg News, The US economy has stalled for the fourth consecutive week as new virus cases continue to surge and some lockdown measures have been reinstated. In the week ending July 24, we saw a decline in US public transit ridership, airline passengers, mortgage applications, consumer confidence, and same-store sales.

With the election only three months away, American voters will have to decide whether to re-elect President Donald Trump to a second term against a backdrop of the virus-induced recession and his response to the health crisis. Not surprisingly, Donald Trump floated the idea of delaying the election in a tweet yesterday morning, suggesting once again the false claim that widespread mail-in voting would make the election “inaccurate and fraudulent.” The president has no power to postpone or cancel an election on his own, and his comment triggered a hugely negative response from both his own party and the Democrats. 

In the meantime,a $600 weekly supplement to unemployment benefits that has provided a key economic lifeline for millions of Americans ends today with Republicans and Democrats still quarrelling over a path forward. This, while US coronavirus deaths now top 152,000, hitting records in Texas and Florida and Dr. Anthony Fauci warns that the disease is spreading rapidly to the Midwest.

BOTTOM LINE

The Canadian economy is outpacing the US in the early recovery period.

Some of the initial bounce-back in Canada – particularly in the housing market – probably reflects the release of pent-up demand generated during the lockdown. Unprecedented income supports have also helped prop up near-term household purchasing power. Payments from CERB alone looked larger than total wage losses through the downturn in April, and we expect to see more of the same in May payroll employment and wage numbers in the week ahead.

The threat of a resurgence in virus spread will still limit the amount that the economy can recover over the second half of this year – and activity in the oil and gas sector still looks exceptionally soft. We still expect GDP to be more than 5% below year-ago levels, and the unemployment rate elevated, in Q4. But there is some scope for Canada to outperform the US in the very near-term, provided virus spread can remain relatively well contained.

According to early advance data for July published by RBC economics, retail and recreation activity in Canada continues to recover more quickly than in the US states suffering surging COVID cases (see chart below).

Dr. Sherry Cooper

DR. SHERRY COOPER

Chief Economist, Dominion Lending Centres
Sherry is an award-winning authority on finance and economics with over 30 years of bringing economic insights and clarity to Canadians.

More Posts – Website

Follow Me:
TwitterFacebook

BoC UPDATE: BANK OF CANADA HOLDS RATES STEADY AND CONTINUES QE PROGRAM

Latest News Mark Goode 21 Jul

Bank of Canada Holds Target Rate Steady
Until Inflation Sustainably Hits 2%

The Bank of Canada under the new governor, Tiff Macklem, wants to be “unusually clear” that interest rates will remain low for a very long time. To do that, they are using “forward guidance”–indicating that they will not raise rates until capacity is absorbed and inflation hits its 2% target on a sustainable basis, which they estimate will take at least two years. As well, they indicate that the risks to their “central” outlook are to the downside, which would extend the period over which interest rates will remain extremely low. The Bank also made it clear that they are not considering negative interest rates. The benchmark interest rate remains at 0.25%, which is deemed to be its the lower bound.

The Bank is also continuing its quantitative easing (QE) program, with large-scale asset purchases of at least $5 billion per week of Government of Canada bonds. The provincial and corporate bond purchase programs will continue as announced. The Bank stands ready to adjust its programs if market conditions warrant.

With the benchmark rate at its effective lower bound, the Bank’s quantitative easing is the way it is lowering mid- to longer-term interest rates, reducing the borrowing costs for Canadian households and businesses. The Bank assumes that the virus will be with us for the entire forecast range, which is two years.

The Bank released its new economic forecast in today’s July Monetary Policy Report (MPR). The MPR presents a central scenario for global and Canadian growth rather than the usual economic projections. The central scenario is based on assumptions outlined in the MPR, including that there is no widespread second wave of the virus in Canada or globally.

The Canadian economy is starting to recover as it re-opens from the shutdowns needed to limit the virus spread. With economic activity in the second quarter estimated to have been 15 percent below its level at the end of 2019, this is the most profound decline in economic activity since the Great Depression, but considerably less severe than the worst scenarios presented in the April MPR. Decisive and necessary fiscal and monetary policy actions have supported incomes and kept credit flowing, cushioning the fall and laying the foundation for recovery.

Mincing no words, the MPR acknowledged that the COVID-19 pandemic has caused a “worldwide health-care emergency as well as an economic calamity.” The course of the pandemic is inherently unknowable, and its evolution over time and across regions remains highly uncertain.

In Canada, the number of new COVID-19 cases has fallen sharply from its April high, and the economic recovery has begun in all provinces and territories and across many sectors. Consequently, economic activity is picking up notably as measures to contain the virus are relaxed. The Bank of Canada expects a sharp rebound in economic activity in the reopening phase of the recovery, followed by a more prolonged recuperation phase, which will be uneven across regions and sectors (Figure 1 below). As a result, Canada’s economic output will likely take some time to return to its pre-COVID-19 level. Many workers and businesses can expect to face an extended period of difficulty.

There are early signs that the reopening of businesses and pent-up demand are leading to an initial bounce-back in employment and output. In the central scenario, roughly 40 percent of the collapse in the first half of the year is made up in the third quarter. Subsequently, the Bank expects the economy’s recuperation to slow as the pandemic continues to affect confidence and consumer behaviour and as the economy works through structural challenges. As a result, in the central scenario, real GDP declines by 7.8 percent in 2020 and resumes with growth of 5.1 percent in 2021 and 3.7 percent in 2022. The Bank expects economic slack to persist as the recovery in demand lags that of supply, creating significant disinflationary pressures.

Bottom Line

Governor Macklem said in the press conference that what he wants Canadians to take away from today’s Bank of Canada’s actions is “Canadian interest rates are very low and will remain very low for a very long period”. The reopening of the Canadian economy is well underway. Economic activity hit bottom in April and began expanding in May and accelerated in June. About 1.25 million of the 3.0 million jobs that were lost in March-April, were added in May and June.

Some activities, including motor vehicle sales, have already seen a strong pickup since April. Likewise, housing activity fell sharply during the lockdown but is beginning to recover quickly. In contrast, some of the hardest-hit businesses, such as restaurants, travel and personal care services, have only just started to see improvements in recent weeks and are expected to continue to face significant challenges.

The chart below, from July’s MPR, shows that household spending patterns have shifted since the onset of the pandemic. Some of these shifts might last. In the central scenario, the effects of the downturn and lower immigration hold down housing activity over the next few years. After a near-term boost from pent-up demand, residential investment slowly increases as income and confidence recover.

Dr. Sherry Cooper

DR. SHERRY COOPER

Chief Economist, Dominion Lending Centres
Sherry is an award-winning authority on finance and economics with over 30 years of bringing economic insights and clarity to Canadians.

More Posts – Website

Follow Me:
TwitterFacebook

DLC UPDATE: Canadian Home Sales Up Again in June

Latest News Mark Goode 21 Jul

Housing Market Continued Its Rebound in June and Early July

There was more good news today on the housing front. Home sales rebounded by a further 63% in June, returning them to normal levels for the month–150% above where they were in April when the pandemic-induced lockdown paralyzed the economy (see chart below). Data released this morning from the Canadian Real Estate Association (CREA) showed that for Canada’s largest housing markets, activity was strong. Sales rose 83.8% (month-over-month) in the Greater Toronto Area (GTA), 75.1% in Montreal, 60.3% in Greater Vancouver, 99.7% in the Fraser Valley, 54.9% in Calgary, 59% in Edmonton, 22.5% in Winnipeg, 34.8% in Hamilton-Burlington, 67.9% in London and St. Thomas, 55.6% in Ottawa and 43.6% in Quebec City. These m-o-m gains reflect the pent-up demand from what would have been a stellar spring housing season.

On a year-over-year basis, national home sales were up 15.2% in June.

Anecdotal evidence suggests that home sales continued to be robust in the first weeks of July. Daily tracking thus far this month indicates that activity has strengthened further in July.  According to Costa Poulopoulos, Chair of CREA, “realtors across Canada are increasingly seeing business pick back up”.

New Listings

The number of newly listed homes shot up by another 49.5% in June compared to the prior month with gains recorded across the country.

The national sales-to-new listings ratio tightened to 63.7% in June compared to 58.5% posted in May. There were only 3.6 months of inventory on a national basis at the end of June 2020 – a 16-year low for this measure.

Home Prices

The Aggregate Composite MLS® Home Price Index (MLS® HPI) climbed 0.5% in June 2020 compared to May (see Table below). Of the 20 markets currently tracked by the index, 17 posted m-o-m gains.

Generally speaking, prices are re-accelerating east of Manitoba, except Toronto for now. B.C. prices are also picking up except for Vancouver. Home prices are declining in Calgary, while elsewhere on the Prairies, prices are either flat or rising.

As usual, the price movements announced by the local real estate associations (for example, TREB in Toronto) were misleading because they are greatly affected by the types and sizes of housing sold during any month. The MLS® HPI provides a more accurate way to gauge price trends because it corrects for the changes in the mix of sales activity from one month to the next.

The actual (not seasonally adjusted) national average price for homes sold in June 2020 was almost $539,000, up 6.5% from the same month the previous year.

The national average price is heavily influenced by sales in the Greater Vancouver and the GTA, two of Canada’s most active and expensive housing markets. Excluding these two markets from calculations cuts more than $107,000 from the national average price. In the months ahead, the extent to which sales fluctuate in these two markets relative to others could have significant compositional effects on the national average price, both up and down.

Bottom Line

CMHC has recently forecast that national average sales prices will fall 9%-to-18% in 2020 and not return to yearend-2019 levels until as late as 2022. I continue to believe that this forecast is overly pessimistic. Here we are in the second half of 2020, and the national average sales price has risen 6.5% year-over-year.

The good news is that the housing market is contributing to the recovery in economic activity. While the course of the virus is uncertain, Canada’s government has handled the COVID-19 situation very well from both a public health and a fiscal and monetary perspective. You only need to look at the debacle south of the border to see how well we have done. The future course of the economy here will depend on the virus. While no one knows what that will be, suffice it to say that Canada’s economy is en route to a full recovery, but it may well be a long and bumpy one.

The Bank of Canada had its first meeting today with Tiff Macklem at the helm. The Bank of Canada said full recovery from the virus would take two years (more on that in the next email).

Dr. Sherry Cooper

DR. SHERRY COOPER

Chief Economist, Dominion Lending Centres
Sherry is an award-winning authority on finance and economics with over 30 years of bringing economic insights and clarity to Canadians.