|
|
 |
|
|
|
|
|
|
|
General Mark Goode 15 Oct
|
|
|
|
|
|
|
|
|
|
General Mark Goode 8 Oct
|
|
|
|
|
|
|
|
|
General Mark Goode 10 Sep
|
|
|
|
|
|
|
General Mark Goode 9 Sep
|
|
|
General Mark Goode 7 Sep
|
|
|
|
|
|
General Mark Goode 19 Aug
Annual Inflation Hits 3.7% in Canada–A New Election Issue
This morning’s Stats Canada release showed that the July CPI surged to a 3.7% year-over-year pace, well above the 3.1% pace recorded in June. This is now the fourth consecutive month in which inflation is above the1% to 3% target band of the Bank of Canada. And given the flash election, opposition parties are already making hay. “The numbers released today make it clear that under Justin Trudeau, Canadians are experiencing a cost of living crisis,” Conservative Leader Erin O’Toole said in a statement. He went on to suggest that the Liberal government is stoking inflation with its debt-financed government spending programs.
While it is true that deficit spending has surged during the pandemic, the same is also true for nearly every country in the world. Moreover, accelerating inflation is a global phenomenon and most central banks believe it to be temporary. Certainly, Tiff Macklem is firmly of that view, as is the Fed Chair Jerome Powell.
Supply disruptions and base effects have largely caused the rise in inflation. Semiconductor production, for example, slumped during the 2020 lockdowns, and then couldn’t be ramped up fast enough when demand for cars and electronics returned, leading the prices of new and used autos to rise at a record pace. Prices for airfares and hotel stays also jumped. Companies found themselves short of workers as they reopened, leading some to offer bonuses or boost wages and subsequently raise prices for consumers.
Central bankers believe that the price pressures are transitory, representing temporary shocks associated with the reopening of the economy. Lumber prices, for example, spiked when demand for new homes returned and have since normalized (see the chart below). To be sure, above-target inflation has heightened uncertainty. The central banks do not want to choke off the economic recovery through misplaced inflation fears. Many Canadians remain out of work, and long-term unemployment is still very high. Moreover, the recent surge of the delta variant proves that the recovery is uncertain.
Governor Tiff Macklem, whose latest forecasts show inflation creeping up to 3.9% in the third quarter before easing at the end of the year, has warned against overreacting to the “temporary” spike.
Shelter Prices Rising Fastest
Prices rose faster year over year in six of the eight major components of Canadian inflation in July, with shelter prices contributing the most to the all-items increase. Conversely, prices for clothing and footwear and alcoholic beverages, tobacco products and recreational cannabis slowed on a year-over-year basis in July compared with June.
Year over year, gasoline prices rose less in July (+30.9%) than in June (+32.0%). A base-year effect continued to impact the gasoline index, as prices in July 2020 increased 4.4% on a month-over-month basis when many businesses and services reopened.
In July 2021, gasoline prices increased 3.5% month over month, as oil production by OPEC+ (countries from the Organization of Petroleum Exporting Countries Plus) remained below pre-pandemic levels though global demand increased.
The homeowners’ replacement cost index, which is related to the price of new homes, continued to trend upward, rising 13.8% year over year in July, the largest yearly increase since October 1987.
Similarly, the other owned accommodation expenses index, which includes commission fees on the sale of real estate, was up 13.4% year over year in July.
Year-over-year price growth for goods rose at a faster pace in July (+5.0%) than in June (+4.5%), with durable goods (+5.0%) accelerating the most. The purchase of passenger vehicles index contributed the most to the increase, rising 5.5% year over year in July. The gain was partially attributable to the global shortage of semiconductor chips.
Prices for upholstered furniture rose 13.4% year over year in July, largely due to lower supply and higher input costs.
Core Measures
The average of core inflation readings, a better gauge of underlying price pressures, rose to 2.47% in July, the highest since 2009.
Monthly, prices rose 0.6% versus a consensus estimate of 0.3%. Rising costs to own a home are one of the biggest contributors to the elevated inflation rate, following a surge in real-estate prices over the past year.
Bottom Line
Today’s inflation data likely did little to alter the Bank of Canada’s view that above-target inflation will be a transitory phenomenon. They are already ahead of most central banks in tapering the stimulus coming from quantitative easing. They do not expect to start increasing interest rates until the labour markets have returned to full employment, which they judge to occur in the second half of 2022. In the meantime, pent-up demand in Canada is huge as people tap into their involuntary savings during the lockdown to pay higher prices at restaurants, grocery stores and gas stations. Financial markets appear to be sanguine about the prospect for rate hikes, as bond yields have been trading in a very narrow range.
General Mark Goode 14 Jul
The Bank of Canada raised its inflation forecast in the newly released July Monetary Policy Report (MPR), making it one of the most hawkish central banks in the world. The Bank announced its third action to reduce its emergency bond-buying stimulus program by one-third. The central bank was among the first from the advanced economies to shift to a less expansionary policy last April when it accelerated the timetable for a possible interest-rate increase and pared back its bond purchases. In today’s press release, the Bank announced it would adjust its quantitative easing (QE) program again to a target pace of $2 billion per week of Government of Canada bond purchases–down $1 billion from its prior target of $3 billion per week. This puts upward pressure on bond yields, all other things constant. No doubt, the federal government’s funding of the enormous Covid-related budget deficits has been abetted by the central bank’s bond-buying.
The pace of purchases of Canadian government bonds was as high as $5 billion last year. The central bank acquired a net $320 billion of the securities since the start of the Covid-19 pandemic. The bank owns about 44% of outstanding Canadian government bonds.
The Bank of Canada has said it wants to stop adding to its holdings of government bonds before it turns its attention to debating rate increases. Still, officials chose not to accelerate the projected timeline for a possible hike today.
In holding the overnight rate at the effective lower bound of .25%, the Governing Council reaffirmed its “extraordinary forward guidance” that the Canadian economy still has considerable excess capacity. The recovery continues to require extraordinary monetary policy support. “We remain committed to holding the policy interest rate at the effective lower bound until economic slack is absorbed so that the 2% inflation target is sustainably achieved,” the central bank said in the policy statement. In the Bank’s July projection, this happens sometime in the second half of 2022.
Swaps trading suggests investors are fully pricing in a rate hike over the next 12 months and a total of four over the next two years, which would leave Canada with one of the highest policy rates among advanced economies. This puts the Bank of Canada ahead of the Fed in raising interest rates. Chair Powell told Congress today that the US economy isn’t ready for bond tapering. “Reaching the standard of ‘substantial further progress’ is still a ways off,” he said in prepared remarks. In the U.S., investors aren’t pricing in any rate hike over the next year and only two over the next two years.
July Monetary Policy Report
The Bank revised its forecast for Canadian GDP growth this year from 6.5% in the April MPR to 6.0% because of the more restrictive third-wave pandemic lockdown in the second quarter. Growth is now expected to pick up strongly in the third quarter of this year. Consumer confidence has returned to pre-pandemic levels, and a high share of the eligible population is vaccinated. As the economy reopens, consumption is expected to lead the rebound, increasing spending on services such as transportation, recreation, and food and accommodation.
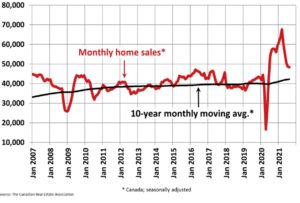
Housing resales have moderated from historically high levels but remain elevated (Chart below). Other areas of housing activity—such as new construction and renovation—remain strong, supported by high disposable incomes, low borrowing rates and the pandemic-related desire for more living space.

CPI Inflation Boosted By Temporary Factors
The Bank revised up its inflation forecast for this year but asserted once again that inflation would return to 2% in 2022. This is a controversial call consistent with central-bank mantras around the world. The BoC said, “Three sets of factors are leading to this temporary strength. First, gasoline prices have risen from very low levels a year ago and are above their pre-pandemic levels, lifting inflation. Second, other prices that had fallen last year with plummeting demand are now recovering with the reopening of the economy and the release of pent-up demand. Third, supply constraints, including shipping bottlenecks and the global shortage of semiconductors, are pushing up the prices of goods such as motor vehicles.
The BoC expects CPI inflation to ease by the start of 2022 as the temporary factors related to the pandemic fade. Economic slack becomes the primary factor influencing the projection for inflation dynamics thereafter. The uncertainty around the outlook for the output gap and inflation remains high. Because of this, the estimated timing for when slack is absorbed is highly imprecise. In the projection, this occurs sometime in the second half of 2022. After declining to 2% during 2022, inflation is expected to rise modestly in 2023 as the economy moves into excess demand. The excess demand and resultant increase in inflation to above target are expected to be temporary. They are a consequence of Governing Council’s commitment to keeping the policy interest rate at the effective lower bound until economic slack is absorbed so that the 2% inflation target is sustainably achieved.
Inflation is expected to return toward the target in 2024. The projection is consistent with medium- and long-term inflation expectations remaining well-anchored at the 2% target. Both businesses and consumers view price pressures as elevated in the near term. A large majority of respondents to the summer 2021 Business Outlook Survey now expect inflation to be above 2% on average over the next two years. Nonetheless, firms view higher commodity prices, supply chain bottlenecks, policy stimulus and the release of pent-up demand as largely temporary factors boosting inflation higher in the near term.
Bottom Line
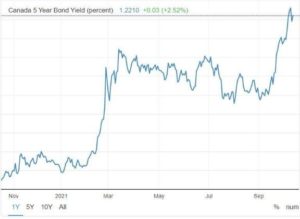
Only time will tell if the Bank of Canada is correct in believing that inflation pressures are temporary. Financial markets will remain sensitive to incoming data, but for now, bond markets seem willing to accept their view. The 5-year GoC bond yield has edged down from its recent peak of 1.0% posted on June 28th to a current level of .936%. As well, the Canadian dollar has weakened a bit, to US$0.7993, since the release this morning of the BoC policy statement. The loonie, however, remains among the strongest currencies this year vis a vis the US dollar.
General Mark Goode 15 Jun
|
|
|
|
|
|
|
|
|
|
|
|
|
General Mark Goode 9 Jun
|
|
|
|
General Mark Goode 2 Jun

Housing Drove the Economic Expansion in Q1
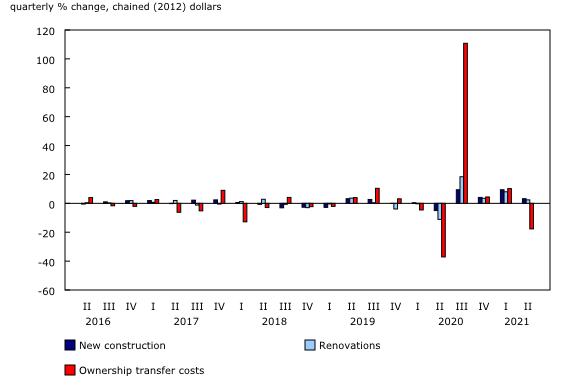
Residential investment is a component of the Gross Domestic Product accounts and is technically called ‘gross fixed capital formation in residential structures’ by Statistics Canada. Investment in residential structures is comprised of three components: 1) new construction, 2) renovations and 3) ownership transfer costs. The first two components are obvious.
The home-resale market’s contribution to economic activity is reflected in ‘ownership transfer costs.’ These costs are as follows:
Growth in housing investment was broad-based. New construction rose 8.7% (quarter-over-quarter), largely driven by detached units in Ontario and Quebec. Ownership transfer costs increased 13.1%, with the rise in resale activities. Working from home and extra savings from reduced travel heightened the demand for, and scope of, home renovations, which grew 7.0% in the first quarter.


Strength in oil and gas extraction, manufacturing of petroleum products, and construction industries led to a higher gross operating surplus for non-financial corporations (+11.5%). Higher earnings from commissions and fees bolstered the operating surplus of financial corporations (+3.9%), coinciding with the sizeable increases in the value and volume of stocks traded on the Toronto Stock Exchange (TSX).
Most aspects of final sales were solid in Q1, with consumers a bit stronger than expected (2.8% a.r.), government adding (5.8%), and net exports also contributing. In contrast, business investment was one real source of disappointment, with equipment spending surprisingly falling. But the biggest drag came from a drop in inventories, with this factor alone cutting growth 1.4 ppts in Q1, and versus expectations, it could add a touch. The good news is that this should reverse in Q2, supporting activity in the current quarter.
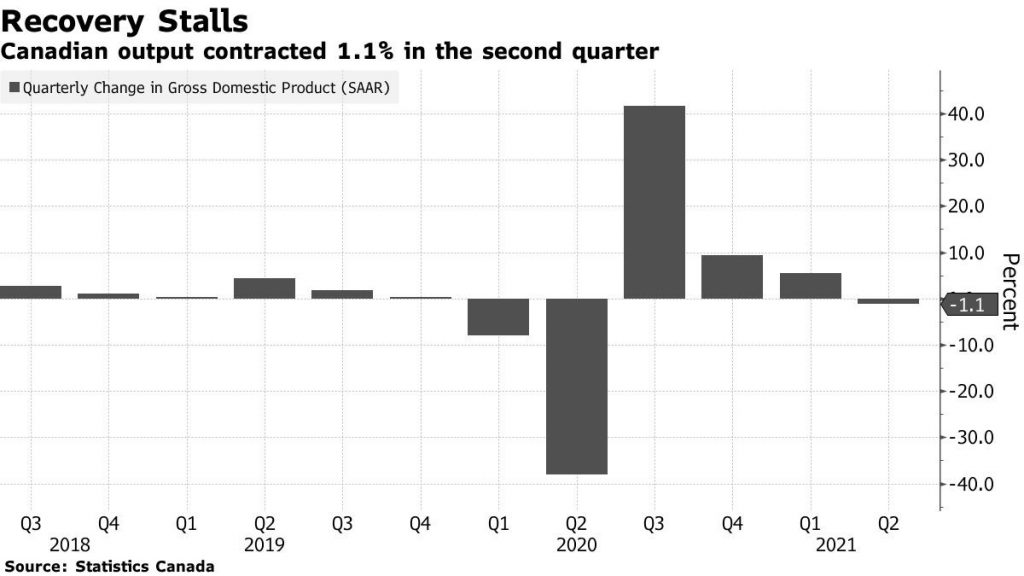
On the monthly figures, there were few big surprises. March’s initial flash estimate of +0.9% was nudged up in the official estimate to +1.1% as the economy began to re-open from the second wave. Tougher COVID public health rules slammed the brakes on Canada’s economy in April. Statistics Canada estimates gross domestic product shrank 0.8% in the month, representing the first contraction in a year and a weak handoff heading into the second quarter. April may well be followed by a soft May. Even so, we still expect a strong June will keep Q2 roughly flat overall and look for robust Q3 growth.
Bottom Line
In many respects, Q1 data is ancient history. We know with the resurgence in lockdowns, growth in Q3 will at best be flat. In the hopes that vaccinations will accelerate and COVID case numbers will continue to fall across the country, Q4 will likely see a strong resurgence in growth.